Polish Y-DNA Clades WANCLIK
|
|
DYS393:13 |
DYS390:25 |
DYS19:16 |
DYS391:10 |
DYS365a:11 |
DYS385b:14 |
DYS426:12 |
DYS388:12 |
DYS439:11 |
DYS389-1:13 |
DYS392:11 |
DYS389-2:29 |
DYS458:17 |
DYS459a:9 |
DYS459b:9 |
DYS455:11 |
DYS454:11 |
DYS447:23 |
DYS437:14 |
DYS448:20 |
DYS449:33 |
DYS464a:12 |
DYS464b:12 |
DYS464c:15 |
DYS464d:15 |
DYS464e:16 |
DYS464f:16 |
DYS460:11 |
DYSgata4:11 |
DYSycaiia:19 |
DYSycaiib:23 |
DYS456:17 |
DYS607:15 |
DYS576:18 |
DYS570:19 |
DYScdya:34 |
DYScdyb:35 |
DYS442:14 |
DYS438:11 |

Peter Gwozdz
pete2g2@comcast.net
I have not updated anything
significant in this web page since January. Busy with other things. I plan to do an update in mid July.
My methods and results have been published.
The Polish Project has assignments of men to haplogroups based on their Y-DNA data. I
hypothetically subdivide haplogroups into types when division can be done with 80% confidence. About half of Polish men belong to
haplogroup R1a. The R1a Results Table has a summary of the R1a assignments. If you know your assignment you can
click on the link in the right column of the Table to read more about your
assignment category.
Lawrence Mayka, administrator of the
Polish Project, provides data for this web site of mine. This web document is for explanation,
details, and update news.
Abstract rewrite
This Abstract is for people reasonably
familiar with the jargon of genetic genealogy. If you are new to genetic genealogy
you might prefer to read the Introduction first.
This web document has three
purposes: 1. More detailed
explanations for the men (samples) that I assign to types in the Polish Project. 2. Summary of my published results. 3. Update with recent results.
The topic is common Polish Y-DNA clades - identification of male line Y-DNA clusters that are concentrated in
Since I originally posted this in
December 2007, emphasis has been haplogroup R1a, because about half of Polish men
are R1a, with no subdivision at that time. A new division, roughly 50-50, between R1a1a* and
R1a1a7 (M458), became available in November 2009. In 2010 I expanded this page to
include clades from other haplogroups.
I use the word type to mean an STR cluster with statistical validity as established by my Mountain Method. I expect my types to be validated some day by discovery of new SNPs that will qualify them
as haplogroups. I chose the
word “type” because it is not generally used in genetic genealogy and I wish to
distinguish my types from haplogroups and from other clusters. All types have associated clusters but
not all clusters qualify as types. In
my publications and web pages I make it clear which types I have discovered in web data
and which types were suggested to me by others, with references. Usually
when I discover a type I later find out someone else had mentioned it earlier
on the web; let me know if
you the reader have more clues and references for me.
Most types that I discuss seem to be
1,000 to 5,000 years old, so all the men in each type seem to be descended in
direct male lines from one man (MRCA) who lived that long ago (TMRCA). A few of my types might be younger or
older than that range.
I use phrases like “seem to be” over
and over because the methods are statistical.
Click here for a summary of the
conservative automatic haplogroup assignments in the Polish Project, for an explanation of the extended assignments, for a discussion of
the minimum 80% probabilityfor assignment, and for
the R1a Results Table.
The Polish Project is considered representative
of Historical Poland, with caveats explained in my Publication.
Abstract rewrite
About half the men of Polish male line
ancestry belong to the R1a haplogroup. About
99% of Polish R1a are R1a1a. This R1a Abstract is a summary
discussion of the R1a Results Table.
U category. Unassigned. This is the largest category in
R1a. On the Polish Project Y-DNA Results page, detailed assignments are made with minimum 80% probability. Because of the restriction to 80% probability,
many R1a men in the Polish Project are not assigned to detailed categories at
the Polish Project web page. Those
men go into this “Unassigned” category. These
still have either R1a or R1a1 automatically assigned by FTDNA. If you are
in this U category, you can promote yourself out by purchasing the full 67
marker STR set, since all R1a samples with 67 markers get a detailed assignment.
I consider the R1a Polish data as 4
major categories based on STR data. About
half the men of Polish male line ancestry belong to the R1a haplogroup, and
that group divides roughly equally into these 4 categories. Since 2007, I have been calling them P type, N type, K type, and R category. P and N are in the new R1a1a7
(M458). P is R1a1a7b
(L270). K is R1a1a*. R is mostly R1a1a*.
R, Remainder, is not a type. I use R for samples that do not belong
to any of the types I have identified in R1a1a* so far.
My overall confidence in K type is only 85% because there seem to be unidentified types with
STR values close to K. The modal haplotype for K is essentially the same as the modal haplotype for all of
R1a. However, I have
identified subtypes of K that have much higher confidence. In other words I have higher
confidence for many individual samples. I
have high confidence in the subtypes although I am not sure all the subtypes
assigned to K belong to exactly the same clade along with all the other samples
that I have assigned to K outside the subtypes. Even if K is not a true clade as
defined, however, it clear that the K samples belong to branches in the R1a1a*
tree with nodes very close to each other. The only uncertainty is that there are
likely many other samples that belong in other branches just as close to K.
Borderline categories are not types but are samples that match types with less than
80% probability. Each
Borderline category has discussion below.
P type is concentrated in
In the table I assign each R1a1a*
(M458-) subtype into either K or R based on how distant the STR values are from
K. Some of these are
borderline however. There
is no clean separation of K from R, so the table should not be considered a
high probability separation of K subtypes from the R remainder subtypes. Read the individual type discussions
to see which subtypes fit K with high probability; A type is an example.
Thanks go to Lawrence Mayka, Polish Project
administrator, for extensive email information and assistance.
You can compare data to my types by
clicking this link to instructions for Ysearch.
Reminder: I am concentrating on
This Introduction is for people
unfamiliar with the jargon of genetic genealogy.
There are quite a few web sites with a
general introduction to the subject of genetic genealogy, for example Wikipedia, FTDNA, and Genographic. Back issues of JOGG are good general references. The Y Chromosome Wikipedia article is about male line DNA, also called Y-DNA.
The following several paragraphs are a
brief introduction to genetic genealogy for Y-DNA, providing some definitions
of jargon needed to read my web pages. The
definition words are boldface. I
often use links to those definitions when I use a jargon word for the first
time in a topic. There are
more boldface definitions in the summary of my Methods.
The Y chromosome gets passed from
father to son, so it works just like a male family name. Men are divided into haplogroups based on known rare mutations (most of
them are called single nucleotide polymorphisms SNP) in the Y
chromosome. Division into
haplogroups is done in a manner that has virtually 100% confidence. I say “virtually” because your
confidence in your DNA result from your DNA testing company might be 98% or 99%
or 99.9%; the confidence
for haplogroups is better than that. We
can be virtually certain that all the men in a haplogroup descend in direct
male lines from one man, called the “Most Recent Common Ancestor” (MRCA) for that haplogroup. Time of the Most Recent Common
Ancestor (TMRCA) is
an estimate of how long ago he lived - the age of the haplogroup. Lots of people are working hard to
discover more SNPs on the Y chromosome so that the haplogroups can be divided
further into smaller haplogroups. I’m
doing some work on this, but I’m not discussing it in this web document.
Haplogroups have alphanumeric codes,
like R1a1a. A paragroup is a haplogroup considered without its
known haplogroup branches. When
a new branch is discovered within a paragroup, it gets removed from the
definition; that changes
the meaning of that paragroup. An
asterisk is usually used in paragroup codes, like R1a1a*.
Many people, like me in this document,
try to “stay ahead” of the haplogroups by analyzing other mutations that are
not so rare (called STR) on the Y chromosome. Men submit their Y-DNA data to various
web sites. There are lots
of STR data available on the web. Men
are divided into STR clusters as hypothetical subdivisions of the
haplogroups. All such
clusters are hypothetical. Some
will be validated in the future by new SNP discoveries. There are various statistical methods
for estimating the confidence of STR clusters. I recently published a method that I developed. That
publication has references to other methods. There is a brief summary of my method below.
A few STR clusters are small family
clusters, with the same family name. Y-DNA
is biologically accurate, so some men discover that their Y-DNA does not match
the DNA of their male line cousins identified by genealogy research, due to
secret adoptions, illegitimacies, etc. This
is one of the reasons some people prefer to avoid genetic genealogy. The male line associated with the
Y-chromosome is only one ancestral line. Humans have 24 chromosomes. Anyone who tries to make a family tree
going back 300 years has more than a thousand root tips to be filled by names
of ancestors who lived back then; the
one man at the tip of the male line root is only one of those thousand. That is another reason some
genealogists avoid Y-DNA genetic genealogy - the emphasis on only one line of
descent out of many. That
said, many people enjoy the challenging hobby of figuring out to which ancient
extended male line they belong.
Most STR based clusters have an MRCA
who lived thousands of years ago, before family names were common, so most men
assigned to a typical cluster do not have the same family name.
Many SNP based haplogroups have an
MRCA who lived more than ten thousand years ago, so these span multiple ethnic
groups and nationalities. For
example, the R1a haplogroup is of interest to me. R1a
is most common in Slavic countries but calling R1a Slavic is misleading because
it is found throughout
Again, some people try to stay ahead
of haplogroups, using statistical analysis of STR based clusters to gain
insight into more recent human origins. I
am one of those people. My
interest is Polish origins. This
web document, however, is not for the historical analysis and conclusions,
except for occasional comments to remind us of the goal. This document is dedicated to STR data
and analysis, identifying clusters concentrated in
The bottom of my Method section has
more definitions for a number of genetic genealogy terms.
There are a number of organizations
and commercial companies on the web where you can order a cheek swab kit to
mail in for genetic genealogy analysis, for example FTDNA. I am not associated with the company
FTDNA; I mention them
because I make extensive use of their data; check Google for competitors. At FTDNA, click on Products for cheek
swab kits. DNA results are
confidential unless you register the data at a database; at FTDNA, click on Projects to
register your data into one of the many databases; for example, most of my analysis is
from the data in the FTDNA Polish Project.
I use the FTDNA standard
set of 67 STR markers (plus a
few non-standard ones occasionally). I
do some analysis using the standard FTDNA 12, 25, 37, or 111 STR marker
sets. Other companies use
standard marker sets that may not overlap with all the FTDNA markers.
Ysearch is the largest web database for Y-DNA, run by FTDNA, open to all men,
including men who also register with projects and including men with data from
other testing services. I
use Ysearch often for analysis so of course I encourage you to register your
Y-DNA data at Ysearch. From
the FTDNA site, you can register your data with Ysearch. Or you can type your Y-STR data into Ysearch.
Comment
This topic was completely rewritten
during Dec & Jan; last
update edit
SNP results continue to validate P type and N type.
The SNP called L260 is almost equivalent to what I have been calling P type.
The SNP called M458 is almost equivalent to the combination of what I have been calling P
type plus N type. In other
words, N type is almost equivalent to M458+ L260- (positive result for the M458
SNP test but negative for the L260 SNP).
The bottom of this topic has recommendations for testing regarding these two SNPs.
All L260+ are M458+ if tested for
M458, confirming that L260 defines haplogroup R1a1a1g2 within the M458 haplogroup R1a1a1g.
Test results available to me: 204 M458 and 59 L260, from 213 samples. The following paragraphs summarize
results for the 180 samples that have all 67 standard STR markers. By
“predicted” I mean my type assignment based on STR values, ignoring the SNP results:
All samples predicted P type are
coming out M458+ L260+. 43
of them so far.
All samples predicted N type are
coming out M458+ L260-. 31
of them so far.
In other words, all samples with 67
markers that fit the P type or N type definitions based on STR values are coming out correctly with SNP tests. This is 100% accuracy so far for
samples predicted P type or N type. However,
I am using the words “almost equivalent” because there are outliers:
In the P branch there are only 2
outliers: one with STR
values at the cutoff and one that is 1 step beyond the cutoff for P type.
In the N branch there are 11
outliers; discussed below.
The percent of outliers expected in
the male population is lower than implied by these results because my SNP data
over represents the STR cutoff regions. Such
samples have been prioritized for SNP evaluation in order to better establish
the limits of the types. In
the Polish Project, all samples at or just
beyond the cutoffs have been SNP tested.
In addition, all outliers so far are
“just beyond” P or N types. Almost
all of these could have been predicted into the correct type based on STR
values alone, because so far almost all other “just beyond” M458- samples fit
well to other known types outside the M458 haplogroup. Those 2 P type outliers with SNP data
could have been predicted based on STR data,
with
100% probability (but only >50% statistical confidence due to the small sample size). All
but 3 of the N type outliers could have been similarly predicted.
In my discussion topic, I mention a few caveats, including an explanation of why I use
the word “branch” not “type” for the outliers, with quantitative explanation of
what I mean by “just beyond”.
Recommendations
for R1a men not yet tested for M458 / L260: If you are a member of the Polish Project
with an N Borderline assignment you should purchase the M458 test to determine
your haplogroup. If you
have a P Borderline assignment you should purchase the L260 test. My STR rules for the Polish Project
are complicated, and those rules may not apply to R1a men outside
If you are not a member of the Polish
Project, with all 67 markers, you can compare your
STR values to P type and N type following the Ysearch instructions below. If you fit with
lower step to one of the known types other than N or P you are less likely to
need either SNP test because you would likely come out M458- L260-. If you do not fit well to another
type: If your step (genetic
distance) from P type is less than 6 you are very likely P type; step greater than 9 is very likely not
P type. From steps 6 to 9
you should purchase the L260 test to determine your status. If your step from N type is less than
7 you are very likely N type; step
greater than 12 is very likely not N type. From steps 7 to 12 you should purchase
the M458 test.
For samples known to be M458+, the
single marker DYS385a=10 provides a very high confidence prediction for P type
L260+, as explained below.
Even if your STR values provide a
“very likely” assignment, you do everyone a favor if you test SNPs
anyway. In this case you
are unlikely to learn anything more about your DNA, but as more men perform
these “wildcat” tests, we all gain more confidence that there are no small
clades with unusual STR values waiting to be discovered. There is a slight chance you might
discover that you belong to such a small clade with a “wildcat” STR test.
See L260 and M458 Test Results for more discussion about the data available. The end of that topic has brief speculation on the age and structure of the M458 clade.
See L260 and M458 Test Results; Details for data summaries.
See L260M458Results.xls for all my SNP data.
See also L260 and M458 Signatures.
Polish Project
R1a Assignment News
This topic was updated
If you are R1a but not a Polish Project member, the Ysearch instructions topic has my method for matching to my types. The news in this topic applies to you
if you know your assignment.
If you are P type or N type you would likely come out positive in the SNP test for M458 (M458+). If you are
P type you are likely L260+. N type is likely L260-. If you have not already tested you can
pay the small fee to test for these SNP tests to confirm that you belong to the
corresponding haplogroup.
If you are assigned to P borderline or
to N borderline you would benefit more from the M458 and L260 tests, because
that would provide for you a definite assignment within R1a.
The assignment rules are done with
high probability, so if you are unassigned (category U) there is a low
probability that you would test positive for M458, with probability that
decreases with yourstep (genetic mutation distance) from P or N.
If you have less than the standard 67 STR markers it is generally better to purchase the remaining markers. That way, you are more likely to get
an assignment, because the statistics for STRs improves with more
markers. Nevertheless, if
you are not many steps from P or N you might consider doing the M458 test even
with fewer than 67 markers.
There is a slight chance that you might test
positive for L260 or M458 even if you do not match P or N. The haplogroup corresponding to M458
is old enough that there may be small clades with STR markers very different than P or N. I have not seen one yet, but there is
no way to estimate this probability. I
hesitate to recommend the M458 SNP test for men whose samples are distant from
both P and N in STR values. I
admit you can just wait to see if anyone with STR values similar to yours
matches an SNP, then test for that SNP. However,
we all benefit when some men test for all the new SNPs within an established
haplogroup, because that way we find out the size and rough age of the corresponding
new haplogroup branches. FTDNA offers “deep clade” test packages to test for all possible haplogroup
branches, but my understanding is that L260 and M458 are not yet included in
the R1a deep clade test. You
need to purchase them separately from the advanced markers menu. No doubt FTDNA will add them soon to
the deep clade package.
The Fall 2009 issue of the Journal
of Genetic Genealogy has my publication is
split into two parts:
Part I is my “mountains in haplospace” method for evidence that certain “types”
of STR clusters correspond to clades.
Part II is the application of that method to Common Polish Clades. That article has a lot more detail
than this web page, but that article was last updated in September 2009, so this
web page is an update.
PolishCladesUpdate is my folder for future updates of the Excel analysis files for those
two articles.
This web page will continue as an
introduction and summary, without as much jargon and detail as the articles and
update folder.
The Fall 2010 issue has my publication
announcing the L260 SNP.
R1a Worldwide
Wikipedia has a nice R1a entry with primary
contribution by Andrew Lancaster.
The new SNP named L365 includes what I
have been calling G type, based on preliminary
data. It is too early to
say if other samples in addition to G type are positive for this new SNP.
The new SNP named M417 excludes what I
have been calling C type, based on preliminary
data. So far very few R1a
samples are negative for this new SNP, but it is too early to estimate the
rarity of M417-.
In early 2011 FTDNA released some new SNPs for commercial testing, including the following
for R1a: L365, M417, L366,
L291, and others. To order
new SNP tests, go to your home page at FTDNA, on the left under “My Account”
click on “Order Tests & Upgrades”, then click on “Go To Advanced Orders”
and check “SNP”. Use your
browser search to find the SNP of interest. If you wish to publish your results,
join one of the projects (click on “Projects”) and the administrator with
analyze your data.
L260 and M458 are discussed below.
There are other new experimental SNPs
discussed on the web. I’m
not trying to list everything here, just the ones that are of interest for
discriminating new R1a haplogroup branches.
In my fall 2009 publication I used the notation that was well known at the time, where more than 95%
of R1a was known to be paragroup R1a1. The
R1a1 samples with one of four very rare SNPs that have been known for a few
years were called haplogroups R1a1a through R1a1d. Ysearch still (25 Oct) uses the
notation described in this paragraph. FTDNA Projects still use this notation for automatic assignment of samples. Individual samples are not actually
assigned to a paragroup because most have not been tested for all SNPs. Most R1a samples are listed as
R1a1. Many samples are
listed as just R1a but almost all of those would come out R1a1 if tested for
the appropriate SNP (the well known M17 or M198, or one of the new ones that
all seem to be equivalent). I
mentioned in my publication that all Polish Project R1a were coming out
R1a1. Since then only one
sample (out of 1441 R1a total in the Polish Project) has come out M198-.
New SNPs were discovered equivalent to
SRY10831.2, the original R1a SNP. Subsequently,
rare samples were found positive for some of these new SNPs but negative for
SRY10831.2. I’ll use L62 to
represent these; there are
others that seem to be equivalent. Those
define two small paragroups, R1a(L62, SRY10831.2-) and R1a1(SRY10831.2,
M198-). That previous R1a1
paragroup becomes R1a1a(M198). Accordingly,
when Underhill announced the M458 SNP, he called that haplogroup R1a1a7. L260 was called R1a1a7b when first
discovered. Last spring I
rewrote this entire web page using the notation described in this paragraph.
The recent new SNPs change the
notation again. I shall not
attempt to rewrite this entire web page. As I update topics, I’ll use the
current notation. For
clarity, I’ll add the defining SNP in parenthesis when I do updates.
For example, what I have been calling P type is equivalent to the haplogroup now called R1a1a1g2(L260). What I have been calling N type is equivalent to the paragroup R1a1a1g(M458, L260-).
The choice of which SNP to put in
parenthesis is arbitrary for haplogroup notation. For example, R1a1a1(M17),
R1a1a1(M198), and a few others, all seem to be equivalent. But any day now someone might announce
a few samples that test negative for one of those SNPs and positive for all the
others, which would define a new paragroup and force the renaming of all
branches beyond that new node in the tree.
There is ambiguity in assignment of
samples. For example, a
sample that tests negative for M198 might be called R1a(M198-), but it is not
clear if this sample belongs to the paragroup R1a(L62) or to the paragroup
R1a1(SRY10831.2) if it has not been tested for the latter.
My types have an uncertainty similar
to SNPs. For example, I
said N type is equivalent to R1a1a1g(M458, L260-). Recently two samples showed up in the
Polish Project that are M458, L260- but just beyond N type as defined by STR
fit. We can think of these
two as a new “paratype”, although I’ll not use that word. We classify these two in the Polish
Project as “M458+R”, the Remainder in M458 excluding N type and P type. Actually, as I discuss in the N type topic, it is not statistically certain where to place the cutoff for N
type, so you could argue that the M458+R category has more than two samples in
the Polish Project.
L260 is a new SNP. I published it in the Fall 2010 issue
of JOGG. It has been available as an SNP test since
early April 2010 at FTDNA.
L458 is a new SNP, published by Underhill. It has been available as an SNP test
since early November 2009 at FTDNA.
FTDNA has not yet assigned haplogroup
names to these, so men who test positive are not reported on-line yet at FTDNA
nor at Ysearch, nor at the projects
supported by FTDNA, which include the Polish Project.
Both L260 and M458 are listed at ISOGG
and at the FTDNA draft tree, where M458 is called R1a1a1g and L260 is called
R1a1a1g2.
See R1a Confusion
9 June comment: This web page need update because a
new node has been added to the tree, changing the codes slightly.
Almost all of R1a divides into R1a1a1*
(M17, M198), R1a1a7 (M458), and R1a1a7b (L260). These correspond to my original predicted division.
R1a also has several known rare
groups: R1a*, R1a1*,
R1a1aN, where N = 1 to 6 and 8. There
is also a very rare R1a1a7a. That
asterisk is used for paragroups; R1a1a*,
means haplogroup R1a1a without any of those 8 known branches.
The rare R1a groups are not in my R1a Table. It’s a shame the corresponding STRs
are generally not published in SNP announcements. I don’t know if the rare groups all
together add up to 0.1% or 1% of R1a. Surely
they are less than 3%. My
percentage calculations in my R1a Table do not need adjustment because any Ysearch samples that might belong to these rare clades would probably have
unusual STR values, not falling into one of my types, but still be counted in
the totals. In my R1a Table, rare samples are included in row R. That row R might have a few percent
from these rare groups, but I don’t know exactly how many.
Underhill mentions 7 samples (men) from R1a*, 9 from R1a1*, 14 from R1a1a6, and 1
from R1a1a7a.
Lawrence Mayka, the administrator of
the Polish Project, had been assuring me by email that all the Polish Project
member tests within R1a had been coming out negative for all the rare SNP
subgroups. So if you are a
Polish R1a, you are almost surely R1a1a, the same haplogroup as about half the
men from
On 17 June Mayka informed me of the
first R1a1* (SRY10831.2) (R1a* in the older nomenclature) member in the Polish
Project. My table, does not show this single
exception because the table is for samples with 67 markers, which that one
exception does not have. On
19 June Mayka informed me of evidence that C type might define a new rare subdivision of R1a slightly older than
R1a1a; if this turns out
correct it will be less than 1% of R1a.
An article was published online,
Abstract STR Data See www.gwozdz.org/R1a.html for more discussion
I call this article “Underhill” for
short, because his is the lead name in the list of 34 authors for this major
work.
This web page about Polish Clades was
completely rewritten using this new information. Recent L260 and M458 test results are consistent with (albeit not full proof of) my previous R1a
subdivision into “types” here on this web page about Polish Clades.
Briefly, most of R1a1a is split by
this new mutation into R1a1a7 (M458 positive, or M458+) and R1a1a*
(M458-). See R1a Subdivision for a brief summary of other groups, and for a clarification of what
R1a1a* means.
R1a1a7 is the new M458
haplogroup. R1a1a7 includes
what I have been calling P type and N type here on this web page, even before
M458 was available.
R1a1a* is a new paragroup. This is M458 negative. It includes all my other types,
particularly K type.
This Underhill article has data for
158 “
R1a1a*: 71
samples 44.9%
R1a1a7: 87
samples 55.1%
The 70% confidence interval for R1a1a7
is about 50% to 60% in the Underhill Poland data.
Worldwide 77% of the Underhill data is
R1a1a* (
M458 Results are coming in now for this new SNP test and the Polish Project R1a is splitting about evenly, with a few percent more R1a1a7 than
R1a1a*, although the latter is more common worldwide.
Format
Up to here, I have tried to write this
web page as news and summary, with links to more discussion below. I hope anyone having minimal
familiarity with genetic genealogy jargon has understood. If you read this top to bottom, it
gets progressively more detailed, with more and more jargon. I’m sorry about that, but the audience
is also readers with genetic genealogy experience who want to know how I came
to my conclusions. If you
cannot follow some of this, it is written in a manner that you can jump around
and pick out what you do understand, then come back after you have read more
about genetic genealogy.
If you open this html document with
Word, all the link targets (bookmarks) can be viewed alphabetically or by
location.
Haplogroups in
the Polish Project
The Polish Project on
Here are the FTDNA haplogroup
assignments. The left side of
the table has the totals by major haplogroup. The right side provides only those
haplogroup branches for which there are more than 25 samples; most haplogroup branches have fewer
than 25 samples, not listed here:
|
Haplogroup |
Count |
Percent |
|
Common |
Count |
Percent |
|
|
|
|
|
Branch |
|
|
|
- |
1 |
0.1% |
|
|
|
|
|
C |
5 |
0.4% |
|
|
|
|
|
D |
1 |
0.1% |
|
|
|
|
|
E |
88 |
6.8% |
|
E1b1b1 |
61 |
4.7% |
|
F |
4 |
0.3% |
|
|
|
|
|
G |
37 |
2.9% |
|
|
|
|
|
H |
2 |
0.2% |
|
|
|
|
|
I |
209 |
16.2% |
|
I1 |
63 |
4.9% |
|
|
|
|
|
I2a |
83 |
6.4% |
|
J |
104 |
8.1% |
|
J1 |
28 |
2.2% |
|
|
|
|
|
J2 |
49 |
3.8% |
|
L |
3 |
0.2% |
|
|
|
|
|
N |
95 |
7.4% |
|
N |
54 |
4.2% |
|
|
|
|
|
N1c1 |
30 |
2.3% |
|
Q |
16 |
1.2% |
|
|
|
|
|
R |
711 |
55.2% |
|
R1a |
66 |
5.1% |
|
|
|
|
|
R1a1 |
509 |
39.5% |
|
|
|
|
|
R1b1b2 |
76 |
5.9% |
|
T |
13 |
1.0% |
|
|
|
|
|
Total |
1289 |
100% |
|
|
1019 |
79% |
The left side of the table is a good
estimate of the haplogroup frequencies in Historical Poland, insofar as the
Polish Project is representative of Historical Poland, as discussed in my publication.
The right side of the table is not
representative. This is my
next point for discussion:
About half of those haplogroup FTDNA
assignments in the table above are based on SNP measurements (green text for
haplogroup assignments by FTDNA). About
half are haplogroup predictions based on STR values for samples that do not
have SNP measurements, using an FTDNA proprietary method (red text). The FTDNA predictions are very
conservative - at least 99% probability - they almost always come out as
predicted when an SNP test is done. Because
they are conservative, most FTDNA predictions really belong to a branch
subdivision of the trunk haplogroup to which they are assigned. In addition, many of the green
assignments based on SNP measurements are old, so these do not reflect new SNPs
that became available since they were last tested.
In other words, a conservative prediction
has a low probability of being wrong, but it also has a high probability of
being incomplete.
For example, those 76 men assigned to
R1b1b2 are really mostly R1b1b2a1, and there are SNPs available to further
assign them to eleven smaller haplogroup branches of R1b1b2a1, so those 76 men
can easily obtain more detailed assignments by purchasing the SNP tests. Similarly, those E, I, J, and N men
have more detailed assignments available through SNP tests.
R1a is very different. Almost all of those 66 R1a samples are
really R1a1. They are
classified R1a either because (1) their STR values are unusual, so a very
conservative prediction cannot be made, or (2) they have an old R1a test, made
before R1a1 was available, so they remain listed R1a even though they could be
conservatively predicted R1a1.
In other words, there are really more
than 570 R1a1 samples, 44% of the men in the Polish Project, for whom more
detailed automatic haplogroup assignment is not available through FTDNA. That’s one motivation for this web
page of mine.
This topic was updated
Haplogroups are defined by SNP mutations. STR mutations are easier to test, so many samples have STR data
without SNP data. Predicted assignments are based on STR
correlations.
I mentioned above that FTDNA automatic haplogroup predictions (red text means STR predicted vs green text SNP measured)
have about 99% probability. We
use minimum 80% estimated probability for each individual sample in the Polish Project that gets an extended
assignment - a subdivision of its FTDNA assignment. At 80%, many more assignments are
possible. Most extended
assignments are better than 80% probability. Many are better than 95%.
Many samples do not have extended
assignments, but they still have their FTDNA green measured haplogroup (100%
probability) or their FTDNA red predicted haplogroup (99%
probability). These bring up the average for the Polish Project as a
whole.
We are confident that the average is
better than 95%, which is to say that more than 95% of the Polish Project
samples would test positive for the SNP corresponding to their assigned
haplogroup. Excluding R1a the average is likely more than 97%.
Example: E1b1b2a2 (V13) is an example of a
haplogroup category with some extended assignments: Larry has me in this category, which
is 100% probable because I tested positive for the V13 SNP along with 14 other
men in the Polish Project (data in this example is from 25 May 2010). However, Larry’s listing includes 48
men in this category, based on his analysis of STR correlations:
15 green E1b1b1a2. These are of course certain.
28 red E1b1b1 because FTDNA does not
predict beyond that, but these would likely be E1b1b1a2 if tested, because they
have STR values close to those samples that have tested V13+, and unlike the
samples that have tested positive for other branches of E1b1b1. Each has at least 80% probability, and
many are even more probably correct.
2 green E1b1b1 tested for that
previous SNP but not for the current V13, but matching in STR values.
3 green E1b1b1a tested for that
previous SNP but not for the current V13, but matching in STR values.
Note that other E1b1b1 men, both green
and red, fall into other categories at the Polish Project, because they do not
match V13+ samples closely in STR values.
End of E1b1b2a2 example.
R1a is unique because almost half the
Polish Project samples are placed together by FTDNA into R1a1 (M198), which is elsewhere called R1a1a (M198). Many
of our R1a assignments are to types, which are hypothetical, without known SNP
definitions. The minimum 80% estimated probability still applies to each sample and again most are much better than
80%. For type definitions
we are confident that the average is about 90%, which is to say that about 90%
of the Polish Project R1a samples assigned to a type would test positive
someday for an SNP, unique to that type, not yet discovered.
“Cluster” and “Borderline” and
“Unassigned” category probabilities are discussed below.
I have been active helping Larry with
R1a assignments to types since late 2007.
See R1a Confusion.
Comment added
Update
The Polish Project on
272 of the 639 are R1a.
Click on the link in the far right
column to jump down to more discussion for that type.
Read the R1a Abstract for a brief summary of this table.
Those Types and Subtypes are my own code letters, for brevity. Please do not confuse these code
letters with official haplogroups. I have been using such code letters
for R1a assignments in thePolish Project for over 2 years. The
color coding is for ease of comparison on my web pages.
This
table was updated based on 25 May 2010 assignments, R1a, at 67 markers, 272
samples:
|
Cluster |
Group |
Type |
Subtype |
Subcluster |
Samples |
Polish % |
Ysearch |
Link |
|
P |
|
|
|
|
58 |
9.1% |
|
|
|
|
R1a1a7 |
P |
|
|
57 |
8.9% |
||
|
|
R1a1a7 |
|
|
PB |
1 |
0.2% |
|
|
|
N |
|
|
|
|
56 |
8.8% |
|
|
|
|
R1a1a7 |
N |
|
|
44 |
6.9% |
||
|
|
R1a1a7 |
|
|
NB |
12 |
1.9% |
|
|
|
K |
R1a1a* |
K |
|
|
86 |
13.5% |
||
|
|
R1a1a* |
|
K |
|
24 |
3.8% |
|
|
|
|
R1a1a* |
|
A |
|
12 |
1.9% |
||
|
|
R1a1a* |
|
B |
|
6 |
0.9% |
||
|
|
R1a1a* |
|
E |
|
16 |
2.5% |
|
|
|
|
R1a1a* |
|
F |
|
6 |
0.9% |
||
|
|
R1a1a* |
|
H |
|
3 |
0.5% |
||
|
|
R1a1a* |
|
I |
|
13 |
2.0% |
||
|
|
R1a1a* |
|
J |
|
6 |
0.9% |
|
|
|
R |
|
|
|
|
72 |
11.3% |
|
|
|
|
R1a1a* |
|
|
KB |
32 |
5.0% |
|
|
|
|
R1a1a* |
|
C |
|
1 |
0.2% |
|
|
|
|
R1a1a* |
|
D |
|
11 |
1.7% |
||
|
|
R1a1a* |
|
G |
|
14 |
2.2% |
||
|
|
R1a1a* |
|
|
R |
14 |
2.2% |
|
|
|
L |
R1a1a* |
|
|
|
0 |
0% |
|
|
|
|
R1a1a* |
|
M |
|
0 |
0% |
||
|
U |
R1a1a* |
|
|
|
0 |
0% |
|
|
|
Totals |
R1a1a |
|
|
|
272 |
42.6% |
|
|
My Update Folder has an Excel analysis file for each of these types,
plus many more files.
The Ysearch links provide the full modal haplotypes, using a selected subset of the standard FTDNA set of 67 markers. I
entered this data into Ysearch for our convenience. All my modal haplotypedefinitions are available in the Excel file Haplotypes.xls, which also has
experimental types not mentioned here. Below
are Ysearch instructions for quickly comparing your haplotype to all my types at once.
Assignment to types is with at least 80% estimated probability.
The estimated percentage for P, N, K,
and R in the Results Table add up to 42.6%, which is the percent of R1a in the
Polish Project at 67 markers.
Click the Ysearch web links in the Results Table for modal haplotypes, which are my best fits of web data to groups of
men with similar STR data. See
also the haplotype Excel file atPolishCladesUpdate.
Please don’t get confused. The following capital letters are my
code for R1a types. Capital letters are also used for the
large official haplogroups, but that’s different.
Some of the following types have my
Excel analysis file for my November 2009 publication; the files are stored in the Supplementary folder. Many of the
following types have my update Excel analysis at PolishCladesUpdate.
A. Ashkenazi. This seems to be a subtype of K. This type is discussed in my publication, Part II. I have about 90% confidence in that
subtype status, but I am more than 98% certain that A is a valid clade, not
just because of my work, but because the modal haplotype closely matches the
various versions of the most common Ashkenazi haplotype, which has been widely
studied and reported on the web. It
should be emphasized that not all Ashkenazi match this type, and some men in
this type may not be descended from Ashkenazi. This type is not restricted to
B. Another subtype of K, recently
identified by Mayka. Concentrated in
C. Added to Polish Project in Dec 2009 by Mayka, who points out that Didier
Vernade originally pointed out the unusual DYS392=13 value in 2007. DYS392=11 is almost universal in
R1a1a. C type is very
small. There are only 2
Polish Project samples in C type, only 1 at 67 markers, but this type is well
isolated on Ysearch, with 4 different samples with 67 markers. I calculated SBP = 7% using only 37
markers with Ysearch data. None
on Ysearch are identified as “
M417 is one of a few new SNPs that
look like they will receive the notation R1a1a1x, where x = i, j, k, etc.
I’ll update this topic when M417
becomes available for purchase.
D. Concentrated in
Two of the DYS462=12 men in D type
come out at step 13, the last step (cutoff 14). There are also two men with DYS462=11
at step 13, the only men with
D type also has the unusual DYS481=21
value; only 10 samples in
the Polish Project R1a have this value, and all 10 come out D type. One man has the very unusual 20 value
(one of those 2 with DYS462 coming soon). 23 is the standard value for DYS481,
and all the men with step just beyond D type have 23. In other words, the STR pair (481,462)
= (21,12) seems to be a very high confidence indicator of D type within
R1a1a. I confidently expect
that someday an SNP will be discovered corresponding to this STR pair of values,
elevating it to a haplogroup. Unfortunately,
Sorenson does not use the 481 marker, so there are only 3 R1a1 samples on
Ysearch with the D type signature pair (481,462) = (21,12); all 3 are Polish Project members now
assigned to D type. (There are
2 others on Ysearch with this very rare signature pair in other haplogroups -
coincidence - a reminder that the STR pair (481,462) should not be used without
first establishing membership in R1a1a.)
D type is clearly a Polish type: In the Polish Project 8 of those 11 D
type indicate “
E. V. Rudich entered a modal for this
cluster into Ysearch as ID mW7DP, named “North
Eurasian”. Mayka modified
it slightly for the modal used here by me, GNYBG, named “
FH Clade. F and H types were suggested by Mayka. They have the signature (439,511,452 = 11,11,28). They
differ from each other, so I could not make a combined FH type. I can make a reasonable FH cluster, but it is not necessary, since
the FH clade can be better defined as the combination of the three types Fa,
Fb, and H. The original F
type (introduced Jun 2010) was split into Fa and Fb in Dec 2010. DYS452 is not one of the FTDNA standard markers, so not many Polish
Project members have this marker evaluated. Mayka and I helped most of the Polish
Project members in FH, and members just beyond FH, to get 452 evaluated. Samples beyond FH have 452=30. My analysis files do not use 452 for determination of SBP. 452 would not significantly lower SBP
because most of thebackground near the cutoff for each type are samples from the other two. In other words, Fa, Fb, and H are very
well isolated from the rest of R1a, but not so well isolated from each
other. These three FH types
do not seem to be specifically concentrated in
FH Borderline. The borderline samples from Fa, Fb, and H are combined into a single FH Borderline
category in the Polish Project, because these clearly belong to the FH clade
but have less than 80% probability of belonging to any one of the 3 types.
Fa. Ysearch YQ6D2. 66 markers, cutoff, 9 gap 2. SBP = 27%. See FH clade, above.
Fb. Ysearch EFQM7. 56 markers, cutoff, 5 gap 4. SBP = 23%. These samples were the original F
type, before Fa was split off. See
FH clade, above.
H. Ysearch 559EE. 58 markers, cutoff, 7 gap 3. SBP = 14.5%. See FH clade, above.
G. This type was suggested to me by Mayka, who calls it the Pomeranian
cluster. Pomerania is the name of the region on the south shore of the
G type is mentioned only briefly in my publication because not much data was available to me at that time. My GType.xls update analysis file with June 2010 data has excellent results: There are 12 samples in a nice type
with SBP = 11.2%. There is
preliminary evidence of a subtype, Ga, SBP = 23%, but with only 4 samples I did
not enter a modal in Ysearch; see Haplotypes.xls for a list including hypothetical working modals.
Of course, this is very
preliminary. It is
possible, if unlikely, that some of the G type samples still might turn out
negative for L365. It is quite
possible other samples not matching G type might be found L365 positive. I’ll provide updates here.
Those 5 samples are positive for M417,
negative for M458, and negative for a few other new SNPs.
L365 is one of a few new SNPs that
look like they will receive the notation R1a1a1x, where x = i, j, k, etc.
This type should not be confused with
another G type in the N haplogroup.
14 May 2011 comment: Sorry I have not taken the time to
update this G type topic. Recent
data continues to verify that G type seems the same as the haplogroup divided
by L365, now called R1a1a1i.
I. Concentrated in
J. This type was recently suggested by Mayka. Only 6 members in the Polish Project,
but this type is well isolated at SBP= 13%.
K. This seems to be a main R1a1a
type. K type is discussed
at length in my publication, Part II. It is larger than others in the Slavic
lands. P and N (below) are
just as close in STR values to K as they are to each other, probably because the K modal
haplotype is the same as the R1a1 modal haplotype (using the best 34 markers
for K). So far I have
discerned a few subtypes of K in my List of R1a types, but I do not have high confidence that they are all exact
subtypes of K, as explained in my K Borderline discussion. I suppose
that as data accumulates more subtypes will become clear within K and K
Borderline.
In the Results I use K* to signify those samples that match type K but do not match one
of the subtypes. Although I
have high overall confidence in the validity of K type, individual assignments
to K* are not as confident. Because
K is located at the modal heart of R1a, I expect some outlier samples from distantly related clades to match K* fairly closely just due to the
statistics of random STR mutations. Because of the possibility of foreign
outliers, I consider samples at K step 3 to be K Borderline, even though the cutoff for the K definition is 4. Even K*
samples with step <3 have confidence of only 80 to 90%. That’s in Poland, where K is fairly
well defined with SNP = 26%. Worldwide
K* cannot be discerned with confidence. The
Ysearch SNP for K is 71%, not significant. That means there are K borderline
clades close to the K cutoff that are rare in Poland but causing interference
on Ysearch. This is evident
by a glance at the K type results on Ysearch, where “Poland” origin is
concentrated at steps <3, and “Poland” becomes progressively less common at
higher steps. A type is a very high confidence subtype of K, so these caveats about K* do not
apply to the very high confidence of individual assignments to A type, and
similarly to the other subtypes.
The Kurgans are the ones who domesticated the horse more than 6,000 years ago. Many scientist think that one
pre-Kurgan man is the male line ancestor of all R1a1 men who live today. The Kurgan hypothesis is
controversial, and not necessary for this web page. You may have noticed that I used the
letters of “Kurgan” for my original types and categories during 2008.
Ky. Ky type was suggested to me by Mayka
on 21 Dec. I determined a
59 marker definition and I calculated SBP = 17.8%%. This is a small type with only 3
samples in the Polish Project, but there are 2 others on Ysearch.
I use the subscripts “y” and “z” because I am running out of
letters for new types. Going
forward, I’ll use Kx, Kw, etc for new small types composed from men that have
been categorized as K Borderline. Ysearch BBB9T.
Kz. Kz type was suggested to me by Mayka
on 6 Oct. I calculated SBP
= 20.4%. Usually I use the
word “cluster” instead of “type” for SBP > 20%, but I suppose that would be
nit picking in this case. The
same 3 samples are extracted from the Polish Project using 2 to 67
markers. I masked out 5
markers to make a better 62 marker definition.
Two of the three Kz type are
non-Polish men who suspect they have Polish male line ancestry, so it is not
certain Kz type is Polish. Ysearch 9QJFQ.
L. This cluster is highly
hypothetical. It is rare in
Poland, but second in size to K in European R1a1. Larry Mayka suggested this cluster to me. It
is a well known Scandinavian cluster. I
quickly checked it briefly, and it seems to be a “type” by my definition. However, no Polish Project sample
matches at 80% probability yet, so I am not yet using it for classification
here. More documentation
about L will be available here when I find time to study it.
N. This topic was written a few months
ago. For updates, see the
following:
N type is concentrated in Slavic countries. This type is discussed in my publication, Part II.
According to Yhrd N type seems to be spread all around the Slavic lands and central
Europe, common from East Germany to Russia. Within Poland N seems to be slightly
smaller than P. Worldwide, N is much larger than P. N type should be properly studied in a
database that is not restricted to Poland. However, I’ll continue to watch the
Polish Project, because it will be interesting if more data provides
significant Polish subtypes within N. See
the discussion on subtypes, next topics.
Update 5 Oct based on 15 Sep Polish
Project Data: SBP comes out 13.27%, almost the same as the published value of 13.32% in
the 2009 publication. That’s additional confirmation of the
validity of N type. The definition for N type, available at Ysearch 3SEJK since the Summer of 2009, uses 45 markers, cutoff 7, gap 2. Back then there
were 28 samples in the type in the Polish Project at steps less than the 7
cutoff, now there are 53 samples. Back
then there were 3 samples in the gap at steps 7 and 8, now there are 8. N type is now known to require M458+
and L260-, but as explained in L260 and M458 Results most of the samples in the gap and a few beyond the gap are also M485+
L260- outliers. I studied
each of these outliers beyond step 8 (8 of them on 15 Sep). None of them have any close neighbors
in haplospace - each closest genetic match in the Polish Project is very
distant. To me, that means
most of these 8 are probably representatives of small clades with old nodes in
the M458 tree, because so many distant outliers are very unlikely from young
nodes. In a situation like
this, it is arbitrary where to define the cutoff. The cutoff 7 seems too strict for N
type, because some of the step 7 samples have small genetic distance from other
N type samples so those might be outliers from relatively young M458+
nodes. On the other hand,
it does not make sense to consider all M458+ L260- outliers to be N type, using
the broadest definition, because that ignores the insight that most outliers
are probably from old nodes. Someday
new SNPs might be discovered that distinguish the oldest nodes in the M458+
tree. Meanwhile, for
assignment purposes, I decided to use step 10 as the cutoff for N type for
M458+ samples, and step 11 at the cutoff for N Borderline, as explained further
in the topicL260 and M458 Results. Only 2 M458+ samples are excluded from
N type (5 Oct status). Samples
not tested for M458 at steps 5 through 10 are assigned to N Borderline if they
do not fit another type. This is not really a big issue, because out of 35
samples at steps 8 through 10, only 9 samples are not assigned to other types,
and of those 9, 3 are M458+ assigned to N type, 4 are not tested so assigned N
Borderline, 1 is M458+ at step 10 excluded from N type, and 1 is M458- at step
9.
Ysearch N type update 5 Oct based on
28 Sep Ysearch data: Using
the N type definition 3SEJK; 142 samples less than
step 10; 11 are modals,
removed for analysis. Cutoff
comes out 7 with gap 2, same as the Polish Project. SBP comes out 19.5%, almost the same as the Ysearch published value of 20.1%
in the 2009 publication. That’s additional confirmation of the
validity of N type. Back
then there were 55 samples less than step 7, now there are 84.
There are two modals on Ysearch that
match N type perfectly using my 45 marker definition. These two are discussed in the next
topic on subtypes.
Age: N type comes out 2,340 years old using
all 67 markers. See the ASD
sheet in NType.xls at my Update page. See also my
discussion about age caveats. Using the same 58 marker mask that I
used for P type, the age for N type is
2,176 years vs
1,775
years for P type (1,601 years for P type in my Nov 2009 publication). N seems to be a bit older than P.
That 2,340 years result uses all 64
samples assigned to N or N Borderline, including 11 samples at steps 7 to 10
beyond the cutoff. Restricting
to the 53 samples in the mountain below the cutoff of step 7, which would be
used if the M458 and L260 SNPs were not available, the age comes out 2,330
years. So the age is not
very sensitive to where the cutoff is set. That’s because there seem to be only a
few samples that descend from nodes near the cutoff.
The oldest marker is 454, at 24,986
years. 454 is a slow
mutator, tied with 455 for 4th out of 67 markers by the extended Chandler mutation rates. There
are only 5 mutated samples at
The 2nd oldest marker, YCAIIb, at
23,099 years, probably should be excluded because there are 4 samples with recLOH mutation from 19, 23 to 19, 19, and there are another 4 samples with
apparent 2-step mutations from 23 to 21. Again, excluding one old marker does
not have much effect. My
excel file has the markers displayed in a sort by age.
Na, Nb, Nc, and other hypothetical
subtypes of N. My publication and this web page have had Na and Nb as clusters for more than a
year. These still to not
have statistical significance. SBPcontinues to be too high
for these to be valid types. The
one exception is the very small Ng, next topic.
The simplest explanation is rapid
population growth after a population bottleneck. If most of the Polish Project N type
samples come from such a population expansion, we would expect a continuous
random diffusive distribution of STR values, with very few if any statistically
significant STR clusters. Reminder: I consider a low SBP strong evidence
that a type is a valid clade, but a high SBP is not evidence either of validity
nor invalidity, because most clades are not isolated mountains in haplospace with rapid population expansion.
Of course, as data accumulates some
subtypes might stand out as significant within N type.
My subdivision into Na and Nb is based
on the fact that most N type samples have values for 464e&f. Most samples in most haplogroups and
types do not. On 15 Sep, 41
of 64 N type samples have a value at 464e, 64% in the Polish Project. Na is the cluster of samples with a
value at 464e; most of them have 464b = 12. Nb is the cluster of samples without a
value at 464e; most of them have 464b = 15.
The 464 marker set mutates relatively
rapidly, and it is subject to occasional recLOH mutations. It
is not surprising that there is lots of variation in the 464 marker set even
within the clusters Na and Nb. Unfortunately,
there are no strong correlations between 464 and other markers. As mentioned in the previous
paragraphs, Na might be a valid subdivision if population grew quickly and if
the mutation to 464e&f values was an event early in the population expansion. However, that 4643&f mutation may
have occurred twice much later in the population expansion, in which case Na
might be really 2 (or even maybe 3) independent large clades. In addition, there are bound to be a
few independent recent 464e&f mutations, representing small clades, because
all haplogroups have at least a few percent of these. So I see no way to assign samples to
Na with 80% confidence, our requirement for assignments in the Polish
Project. Similarly, Nb is
not necessarily a unique clade. I
suppose I have greater than 50% confidence in the Na vs Nb division of N type,
but that confidence is mostly subjective. If you are N type you can consider
assigning yourself with reasonable confidence to either Na or Nb depending on
your 464 values as explained above.
The Russian site has independently come up with the same haplotype distinction. Two modal haplotypes are available on Ysearch. Each
use 78 markers and each perfectly match my N type, which uses 45 markers,
without 464. These differ
only at the 464 set and at CDYb, one of the most rapidly mutating marker
pair: Central European-1
Modal GTAVR corresponds to my Nb, using only 4 values, 464a-d. Central European-2 Modal 495M5 corresponds to my Na, using 6 values, 464a-f.
My publication mentions a tentative
hypothetical cluster division of Nb based on an apparent weak correlation with
other markers, but further data has gone the other way, so that is no longer
interesting.
My Nc cluster has the signature DYS19
= 15, compared to the modal value of 16. Again, my publication and previous
versions of this web page, proposed Nc as a tentative subdivision cluster of
Nb, because the samples with the 15 value last year had mostly Nb samples, but
this year that correlation is insignificant.
Nc at 12 markers is the 12th most
common haplotype in the Polish Project, 8th within R1a1, and the 2nd most common
at one step from N (1 out of 12). Nd
is more common (389 = 13, 30), but Nd is one step from both N type and K type
so at 12 markers Nd is surely a mix of N and K. Ne and Nf are the next most common 12
marker haplotypes. These
and others are listed in myHaplotypes.xls, but only Ng (next
topic) meets the criterion of SBP < 20% for assignment of samples in the
Polish Project.
Nh cluster is based on that YCAIIb
2-step mutation mentioned above affecting the age of that marker in N
type. The 4 Nh samples are
also in the Na cluster. However,
they are split at that rare 454 marker also mentioned above in the age
discussion. 2 of the Nh
samples have the modal 454 = 11, 2 have the rare 454 = 12. There is a 3rd 454 = 12 with another
apparent unique 2-step mutation, the unusual YCAII = 22, 23. Plus there are 2 samples with 454 =
13, with no mutation at YCAII. The
only conclusion I can draw from this is that rare mutations occurred
independently at least twice in either YCAIIb or 454, or both, so I cannot
establish significant types at this time.
More data will likely help define more
subtypes of N in the future, because my SBP < 20% criterion penalizes small
clusters due to sampling uncertainty, and due to selection bias, as explained
in my publication.
Ng. This is a small subtype, only 3
samples, but it is very well isolated. The
definition uses 56 markers, cutoff 4, gap 9. There are no samples in the gap, from
step 4 to 12. SBP =
15.8%. These same 3 samples
are present in Ysearch, where the gap with no samples is from 4 to 11. Two samples at step 12 are from
Germany and Unknown. There
are none at step 13 and 11 samples at step 14. It seems Ng is concentrated in
Poland. The signature is
(537, 492) = (10, 14). These
are the only 3 Polish Project samples in N type that have any mutation from the
12 value at 492, and they have a 2-step mutation. 492 is ranked 18th of
The simplest explanation is that the MRCA of Ng type lived recently in Poland and passed on those 2 unusual
mutations.
P. This topic was written a few months
ago. For updates, see the
following:
P type is concentrated in
Poland. This type is
discussed at length, in my publication, Part II. It seems that about 8% of Polish men
have male line ancestry of this type. According
to Pawlowski, this cluster is
concentrated in Poland. I
verified this and other Polish types using both Yhrd and Ysearch. P has fewer mutations than N and K, so
it must be younger. My TMRCA age assessment is 1600 years old, but in light of age caveats P type might be 1 to 3 thousand years old. Regardless of age, P type seems to
have had significant population expansion less than 2 thousand years ago. My publicationprovides details on the
size and age calculations along with evidence regarding the validity of P
type. In my R1a web
document, I used P type as an example for a discussion of the caveats associated with TMRCA calculations, and also as an example to explain
the possibility of hidden clades, and also as an example
for population bias in databases such as Ysearch, so you can find lots more discussion about
P type by clicking on those links.
I identified P type and submitted my
analysis for publication before the M458 mutation was announced by Underhill.
L260 is a new SNP that seems to define the haplogroup corresponding to what I
have been calling P type. L260
has not been published yet. My
P type will probably be called R1a1a7b in the near future.
Update 24 Sep 2010: I determined a new definition for P type, which should serve as a good STR predictor for the
corresponding new haplogroup. That
definition is improved because it is based on 70 P type samples with all 67 standard markers who have joined the Polish Project to date. On 24 Sep I
updated my Haplotypes.xls file and my P type definition at Ysearch, code 8U92G. This new definition, with cutoff step 7, captures all 70 of the P type samples in the Polish Project and
none others.
I first uploaded the new P type on 17
Sep, but with further work I found minor improvements and changed the
definition slightly on 24 Sep. My
previous definition for P type had been unchanged since the summer of 2009.
There is only one sample in the Polish
Project just beyond P type at the cutoff value of 7. It is not really a strange coincidence
that the one sample at step 7 is the Y-DNA is for my maternal grandfather,
because his 12 marker match to a large number of Y-DNA samples in 2006 is what attracted me to the study of Y-DNA in the first place. My grandfather’s data (actually from
maternal cousins) is a reminder that it is very unlikely but possible for men
like him who are negative for the M458 marker (ancestral to L260; M458 = P type plus N type) to
nevertheless end up by luck with STR values very close to P type.
On Ysearch (24 Sep 2010) there is also
a minimum for P type at step 7. With
modals removed the number of samples at steps 6, 7, and 8 are 10, 4, 8. There are 68 samples total below the
cutoff step 7. Most but not
all of these are the same samples as in the Polish Project. Of those 4 at step 7 only my
grandfather’s sample is from Poland, the other 3 are Germany, Czech Republic,
and Unknown (name Douglas). This
is a reminder that there may be small clades very close to P type outside
Poland. Accordingly, SBP =
12% for P type on Ysearch.
This recent Ysearch data confirms
again that P type is concentrated in Poland: Below step 6, 32 of the 58 samples
provide Poland as “Origin” (55%), and all of the others are from countries near
Poland or “Unknown” or “USA”. At
step 6, 7 of 10 are Poland. At
the cutoff step 7, 1 of 4 are Poland. At
step 8 only 2 of 12 are Poland - step 8 includes 2 from Scotland and 1 each
from Ireland and Kuwait. At
step 9, only 6 of 33 are Poland and several are from countries far from Poland.
That new definition is 100% accurate
so far in the Polish Project because it captures all the P type samples. That 100% is statistically misleading
because I selected the best markers. I
estimate theconfidence at much better than 95% for future Polish Project samples that match P
type well (below step 6). However,
the confidence is probably more like 80% at step 6, which is the last step
before the cutoff 7. Confidence
at the cutoff is also probably about 80%. In other words, maybe about 20% of new
samples in the Polish Project at step 7 might be positive for the L260
mutation, belonging to the P type haplogroup, but by luck have more mutations
than expected. Also, maybe
about 20% of new samples might be negative for L260 but by luck land at step 6
due to few mutations in those STR markers that are used in the new definition
of P type. I highly
recommend the L260 test for anyone that comes out in steps 5 to 9 from P type.
SBP is not very important for P type
because the L260 SNP test is now available. The new SBP is excellent at 5.5% but Mayka and I purchased SNP tests for all Polish Project men near the cutoff
(those who did not purchase on their own). I was able to select and reject a few
STR markers for the new definition based on SNP results at the borderline near
the cutoff. That makes a
great definition for assignment, but there is more than the usual selection
bias regarding future predictions. The
new SBP may have come out a bit too low because of this bias. However, background should be much
less than SBP for the following reason: SNP
is intended as a statistical worst case estimate of the true background (expected non P type future samples
less than the cutoff). All
things considered, the true background for P type is probably less than
5%. Most of the background
should be concentrated in the last step, which brings me back to the comments
of the previous paragraph.
Reminder: links to my Excel analysis files are available at my Update page.
The primary characteristic of P type
is the extreme isolation in STR haplospace. The brother clade, N type, is easily distinguished by STR
markers. M458 identifies the combined P plus N clade, R1a1a7, but just beyond the
cutoff for P many of the samples are M458 negative, neither P nor N. In other words, a few thousand years
ago, the ancestors of P type and N type diffused away from the R1a modal
haplotype in different directions in haplospace. This makes analysis easier, with clean
separation of samples based on STR values for recommended SNP tests.
Within P type confident identification
of subclades is not reliable with STR values, as discussed below. This is evidence that P type
experienced rapid population growth without a significant population bottleneck, providing a diffusive
continuous distribution of STR values near the modal haplotype.
Age of P type: Of the 67 standard markers, 13 of these
have no mutations in any of the 70 P type samples in the Polish project; 8 markers have only one mutation out
of 70. This low variation
is evidence that P type is young.
The latest analysis with 70 samples
gives 1775 years for a best guess age, compared to the result that I published in 2009, 1601 years, based on 29 samples. The statistics are much better with 70
samples, but as mentioned above age is highly uncertain because of caveats.
That 1775 vs 1601 comparison uses 58
of the 67 standard markers for the ASD age calculation, explained in my
publication. The published
reasons for removing the 9 markers are confirmed by the new data. Using all 67 markers, the new data
with the 70 samples comes out with ASD age 100 years younger than the published result using 67
markers. Using the classic
5 “Thomas” markers the new result is 260 years older. All this demonstrates how age
calculation is statistically uncertain depending upon which markers are used,
as discussed in my publication.
I’ll continue to quote “roughly 1600
years” as the age of P type. 124
years is not significant enough to rewrite all my web discussions.
The L260 mutation might be about the
same age as P type. Unlikely. We expect a defining SNP to be more
likely older than the TMRCA, perhaps much older, if there was a previous
population that suffered a severe population bottleneck.
The Western Slavic Modal haplotype,
Ysearch 28WGP, matches P type
perfectly at all 46 markers used in my new definition. That Western Slavic Modal uses 76
markers, but many of those are highly variable due to high mutation rate. That modal is one of the Russian site modals.
Pc. Update 25 Sep 2010. Hypothetical subtype of P. During the past year Pc picked up one
more sample, decreasing the SBP from 61% to 47%. SBP is not valid as a measure of
quality above 50%, so 47% is marginal at best. Pc is attractive as a hypothetical
type but not yet convincing because it is too small, with only 6 samples, so
the statistics are not good enough yet. I
don’t doubt that at least 3 of the 6 samples in Pc belong to a unique clade,
but I estimate there is at least 50% probability that 1 to 3 of those 6 might
belong to another independent clade that fits the same definition haplotype due
to the luck of random mutations. I
spent some effort in Sep 2010 trying to improve the definition, but my
published 2009 definition is still a satisfactory hypothesis for this
cluster. My definition for
Pc has been available since the fall of 2009 at Ysearch, RQK32. Pc is the most promising cluster
within P type because Pc is the only significant cluster (that I could find)
that differs from P by 3 markers. The
3 markers are 439 = 11, 534 = 14, and 565 = 12. 439 is one of the standard 12; the other two are at the end of the
standard 67.
Pg. Update 26 Sep 2010. Hypothetical subtype of P. During the past year the SBP for my
published Pg increased. That
means my original small cluster Pg is not credible as a subtype. However, I have an interesting new
hypothesis about a larger version of Pg. This takes a few paragraphs to
explain. My new idea is
that Pg represents a major branch within P type.
The signature for Pg is the sole
marker 572 = 11. 572 is the
4th from the last of the standard 67 markers.
I am convinced that 572 is a slowly
mutating marker. I need to
spend a paragraph on this point, because it is listed on the web as the 40th of
the standard 67 (39 are slower), not very slow. Here is the link to the mutation rates. Just glancing at Y-DNA databases on
the web, it seems that 572 is one of the markers that has much less than
typical variance within haplogroups. I
spent some time verifying this in a few haplogroups. Those relative mutation rates were
worked out by Chandler, published in the Fall 2006 issue of JOGG. However, Chandler only evaluated the
first 37 markers because back then there was not enough data on the markers
beyond 37. That web link
for all 67 markers goes to the site of the late Leo Little, and those rates
have not been updated for at least 2 years; apparently Leo obtained the rates for
markers 38 through 67 based on minimal data. I’m not criticizing. I’m only pointing out that the rates
might be way off for a few markers beyond the 37th due to sampling statistics
from a small database. I
offer this as justification for my claim that 572 is probably significantly
slower than the rate (0.00212 mutations / generation) that is currently
available at that web site. Maybe
someone is reevaluating the rates as I type this. If the updated future rate for 572
comes out ranking it again faster than the median in the set of 67 then my new
idea about Pg will not be very credible. My prediction is that reevaluated
rates will show 572 to be much slower than median, 10th to 20th of the 67,
justifying my use of this marker as a good signature for a cluster.
Technical comment: If 572 has a point mutation or indel
near the center of the STR chain, that would significantly reduce the STR
mutation rate, but only in the clade that inherits that mutation.
572 is the 2nd best marker for P
type. Actually, 464c
treated as an individual is the 2nd best, but as I discuss elsewhere individual
makers from the 464 compound set can be misleading. 385a is best. Of the 70 P type samples in the Polish
Project, all have 385a = 10. At
572 there are 50 samples with the value 12, 18 with the value 11, and one each
at 10 and 13. 572 works
well in the definition for P type because the 12 value is relatively rare for
R1a outside P type, and because P type samples with the 11 value match P type
at many other markers. Modal
values for R1a are (385a, 572) = (11, 11). Modal signature values for P type at
these two markers are (10,12). Pg
signature values are (10,11).
The signature 572 <12 extracts
those 19 samples as a large Pg cluster from the 70 P type samples. That signature of course does not work
from R1a as a whole because 572 = 11 is modal for R1a. If I’m correct that
572 is a slow mutator, then most of those 19 samples belong to a major
clade. The trouble
is: we don’t know which of
the 19 are from other independent clades, due to independent mutations. There must be at least a few such
exceptions because 572 is surely not one of the 5 slowest markers.
H type also has the 572 = 12 value.
The Pg cluster is 19 / 70 = 27% of P
type, based on the Polish Project.
My hypothesis: The 572 mutation from 11 to 12 for
P type happened early in the history of P type.
Alternatively, the MRCA of P type might have had the 12 value for 572, and a back mutation to 11
happened early in the history of P type. This alternative scenario is possible
but less likely, because for slow mutating markers with low values it is known
that a step up is much more likely than a step down (see my publication discussion of Whittaker 2003).
The mutation to 12 might have happened
in one of the sons of the MRCA, because by definition an MRCA must have at
least two sons who fathered subclades (if not, then he is not an MRCA). Or a grandson, or great
grandson. Alternatively, if
the mutation happened several generations after the MRCA, there may have been a
population bottleneck in P type, and by luck 73% of the survivors had the new
12 value. Alternatively, if
the 12 value was not so common early in the history, the early part of the
population expansion might have favored a tribe of men with the 12 value. These and more complicated scenarios
come to mind within my primary model that Pg is a major branch of P type.
In this model, we expect many single
marker clusters in P type to be false clusters, bimodal at 572, based on
independent mutations at that single marker in both Pg and in the main P type
trunk. We expect most such
clusters to appear about the same age as P type (about the same variance),
because they are actually two or more clusters with a node early in the P
tree. This in fact is what
I have observed. When I
sort the P type data using a marker that is bimodal, looking like a good
cluster candidate, usually the 2 modes are also bimodal at 572 with both 11 and
12 values.
Pa is the best example. Pa is my original 2006 cluster
candidate within P type, based on the value 31 at 389-2 (actually the value 18
for 389-2 minus 389-1). At
the standard 12 markers, Pa has always been the 3rd most common haplotype
within the Polish Project, after P and K, slightly more common than N
(considered as cluster signatures at 12 markers). It has amazed me over the years that
Pa does not form a credible subtype. I
now note that the 8 samples at 67 markers that have the 12 marker Pa haplotype
are split 4 and 4 at the 572 values 11 vs 12. It appears the mutation to 31 happened
independently at least once in both main branches.
Pc is a counter example. The Pc cluster discussed above has 3
markers that differ from P type. This
one is not expected to show up in both the main branch and the Pg branch. Indeed all the close matches to Pc
have the 572 = 12 value. Pc
appears to be a small branch off the main P type trunk with a younger node than
Pg. At 572 = 11, the 3
closest matches to Pc are distant, step 5 (cutoff is 2), and each of those 3 is
mutated in only 1 of the 3 Pc signature markers.
On 25 Sep, I changed the Ysearch Pg
definition, 92HEK, to be identical to the
P type definition except the value 11 at 572. This is not a valid type, but it
easily highlights samples with the 11 value, as fitting the Pg cluster one step
better than the P type haplogroup.
Reminder: Pg is a hypothesis. However, in the search for SNPs, I
have advice: If a new SNP
is discovered in P type, that new SNP should be checked in samples with both
values at 572, to see if they can be distinguished.
FTDNA has 100 markers available. I checked the markers beyond the 67 on
Ysearch, but there is very little data available. It is too early to say if any of those
will correlate with 572 = 11 for an improved Pg signature.
R. Remainder. Updated 2 Jul 2010. This is not a haplogroup or a type. This is a category for samples that
are distant in STR values from all the R1a1a types I have defined so far. If you are in this category, I highly
recommend that you get all 67 markers plus the M458 test. More markers will help me define a new
type for you. Your M458
test is unlikely to come out positive, but if it does that means you would be
the first member of a new type within M458.
I also recommend that you test for all
the several SNPs that FTDNA considers equivalent to R1a1 (called R1a1a by others). Your unusual STR values make you a
candidate for an unusual small clade that has a very old node with the R1a
tree. Each SNP is unlikely
to come out negative. In
fact, all such tests most likely will come out positive. But if one comes out negative that’s
excellent, because you will join a very rare group, perhaps even define a new
haplogroup. If you cannot
afford all these tests, OK, just hope for people with STR values close to yours
to do the tests and watch this web page for your sample to move into a new
category.
R is equivalent to a paragroup. Just like R1a1a* means only R1a1a
samples that are negative for all known SNP subdivisions, my R category extends
that to mean only samples that do not match any of my known types. At 67 markers, R also means that the
sample does not qualify for one of my borderline categories. I have a policy not to use the U
category for samples with all 67 markers, so in some cases I need to make a
close call on a sample that is on the edge a borderline category - some R
samples are right at my cutoff at 67 markers.
For a sample with 37 or fewer markers,
I require 80% probability that the sample would not match one of my types if
all 67 markers were obtained. There
used to be quite a few R at 37 markers back when I had only a few types, but
there are none right now (July 2010) because there are none that have STR
markers so unusual that they are far from all types.
The 80% rule does not apply to R. If
a sample has 30% probability of belonging to its best fit type it would be
assigned to R. That means
it only has 70% probability of being a true R. R samples still have their FTDNA assignment which is either 100% (green) or 99% (red).
When I started this hobby a couple
years ago, R was the 2nd biggest category after U. I now have enough types that R is
small.
In June 2010 I subdivided R into two
categories. R (M458-) is
those tested negative for M458. R
(needs M458) is those not tested for that SNP. If an R sample would test positive it
would be moved to the NR category.
U. Unassigned. Updated 3 Jul 2010. This is not a cluster, but a holding
place for samples with less than 80% probability for assignment. I
use U in the Polish Project for R1a uncertain samples with less than 67
markers. Samples with all 67 standard markers are not assigned to U, but instead are assigned to the R (remainder)
category, or into “Borderline” categories such as N Borderline or K
Borderline. U is 0% in the
Results Table, which is samples with 67 markers, but considering all samples U
is the largest category in the Polish Project, with 200 members on 25 May 2010
- 15% of the project, 35% of R1a. If
you are classified U you can become promoted to another category by obtaining
results for the remainder of the 67 markers.
The 80% rule does not apply to U. If
a sample has 70% probability of belonging to its best fit type it would be
assigned to U. That means
it only has 30% probability of being a true U. Many U have >30% probability of
belonging to two or more different types. U samples still have their FTDNA assignment which is either 100% (green) or 99% (red).
Probabilities include estimates, so they are not
exact. I tend to be strict for
samples with fewer than 67 markers, using U for marginal situations. At 67 markers is do not use U - I use
R, and I’m not strict at 67. Also,
I concentrate my time on improving the assignment rules at 67 markers and have
not yet found time for 37 marker rules for some of the newer small types.
On 20 July I added the following three
R1b Types to this web document (next three subtopics, L23EE, L47P, L47A).
Mayka had already added these three to the Polish Project web page during the previous week, based on my recommendation, based on my SBP analysis.
I independently found these three by
analyzing the Polish Project R1b data, but Mayka pointed out they were
previously known as clusters. We judge that my analysis justifies
adding them to our list of types. Since
I’m using 639 samples with 67 marker data as representative of Poland, a small type clade at
1% of the Polish population would be expected to have roughly 6 samples in the
database (70% confidence interval 4 to 10). These three small types are roughly 1%
each.
I’m following the current ISOGG codes for these types, which may be confusing compared to the current FTDNA codes.
The STR definitions for these are
available at Haplotypes.xls. PolishCladesUpdate has a link to an Excel analysis file for each of these three
types.
Instructions for Ysearch comparison are below. Here
is the “UserIDs” bar for R1b comparison:
USEID, CX94E,
MKM4R, 7HB9C
Change USEID to your User ID.
Reminder: These two types are calibrated to
Polish data. The definition
modal haplotypes may not be optimal for other regions. If you have Polish ancestors, and if
you have all 67 markers, and if you match one
of these within a step distance of 10 there is more than 80% probability that
you belong to the corresponding clade. Up
to step 15 there is lower probability that you belong. You should test the appropriate SNPs
(explained below) for higher confidence. If your ancestors are not from Eastern
Europe and you are a marginal match (step distance 5 to 15) for one of these,
it is not very probable that you belong to the corresponding Polish clade,
because each of these types has some overlap with other clades that are rare in
Poland.
L23EE. 20 Jul 2010 documentation: This type is positive for the L23 SNP, hence this type is a hypothetical
future haplogroup within the current haplogroup R1b1b2a. This type is negative for L51, the
only current known branch - R1b1b2a1 - of L23.
Nordtvedt pointed out the cluster for this type some years ago, calling it R1b-EE
(Eastern Europe). Mayka suggested the L23EE code to me.
There are only 6 samples in the Polish
Project in this type (13 Jul
2010). SBP = 10.7% using
all 67 markers, which is excellent for such a small type. The cutoff is 12, but if you match at
step 10 through 12 I estimate your probability of belonging at slightly better
than 80%, so you really should test for the L51 SNP - a negative result would
boost the probability to about 95%. In
the Polish Project, there is a gap of 5 - no samples from steps 12 through 16
and all 6 of the samples from step 17 to 20 are L51+. So this type is very well isolated in haplospace in Poland.
On Ysearch (code CX94E) there are also
6 samples in this type (13 Jul 2010), but 3 are the same as in the Polish
Project. There are 7
samples at step 12 (vs zero in the Polish Project) and only 2 of those 12 are
East European - one each in Germany and Russia. That means this type is not well
isolated world wide, meaning samples near the cutoff are highly
uncertain. I interpret this
as evidence that my definition of L23EE type is really a Polish subtype within
a larger L23EE cluster.
This type has evidence of
structure. A number of
markers are bimodal with no obvious correlation. To me, that means there are probably
at least 3 sub-clades that may become evident as data accumulates.
If you match this type closely at 37
markers I highly recommend getting the full 67, because the statistics
for assignment are not convincing at 37 markers. Even at 67 markers, I recommend the
L51 test; a negative result
confirms membership in this hypothetical clade, and a positive result means you
are not a member. We do not
know the probability of outsiders matching L23EE in STR values, particularly
outside Poland, so there is still a slim chance of a surprise - a close match
to the definition but with L51+.
L47P. 20 Jul 2010 documentation: This type is positive for the L47 SNP, hence this type is a hypothetical
future haplogroup within the current haplogroup R1b1b2a1a1d1. This type is probably negative for
L44, the only current known branch - R1b1b2a111d1a - of L47, but that L44
negative indication is based on only one sample so far so it is not certain.
Mayka announced the cluster
corresponding to this type on the web in March 2009.
There are only 4 samples in the Polish
Project in this type (13 Jul
2010). SBP = 9.3% using 64
markers, which is excellent for such a small type. The cutoff is 7 and the gap is
10. There are no samples
from step 7 to 16. Although
samples in that wide gap are expected as data accumulates, this type is very
well isolated in haplospace in Polish data.
This type is very robust; the same 4 samples are selected using
any number of markers from 10 to 67 with SBP <25%.
Actually, this type is even better
than the SBP = 9.3% indicates, because some of the samples at step 17 and
beyond have tested negative for the SNPs in the R1b trunk leading to L47 so
they clearly do not belong to this L47P hypothetical clade.
Ysearch (code MKM4R) also has 4
samples (13 Jul 2010), but 3 of them are the same as the Polish Project. Ysearch has 8 samples at steps 8 to
12, so the type is not as well isolated worldwide.
The “P” in the code L47P represents my
hypothesis that this type is Polish.
Members of this type should test for
L47, because Ysearch does have one STR matching sample listed as R1b1b2a1b,
which is equivalent to P312, an “uncle” haplogroup, that is L47 negative. That means there may be some
interference in STR matching, probably less than 10% in Polish data, but I do
not know what the exact percent interference be until more data accumulates.
See the last paragraph of L47A, next
topic, for more comments.
L47A. 20 Jul 2010 documentation: This type is positive for the L47 SNP, hence this type is another
hypothetical future haplogroup within the current haplogroup
R1b1b2a1a1d1. I do not know
yet if this type is negative for L44, a known branch of L47.
Mayka suggested the “A” code, since this type is obviously Ashkenazi, based on
family names (see also Ysearch results, a few paragraphs down). I presume this one is known to the
administrators of Jewish DNA projects, although I did not do the research to
find a first web publication at 67 markers; I would appreciate an email of a
reference to add here, even if it does not exactly match my
definition. It’s OK if an international modal haplotype differs by a few
markers from a haplotype determined in Poland, particularly if the difference
is at markers that are bimodal, indicating subtype structure.
There are only 5 samples in the Polish
Project in this type (13 Jul
2010). SBP = 7.6% using all
67 markers, which is excellent for such a small type. The cutoff is 10 and the gap is
9. There are no samples
from steps 9 to 18. Although
samples in that wide gap are expected as data accumulates, this type is very
well isolated in haplospace.
This type is very robust; the same 4 samples are selected using
any number of markers from 30 to 67 with SBP <10%.
This type is better yet on Ysearch (code 7HB9C), with 18 samples (13 Jul 2010) for better statistics; SBP = 4.6%, which is remarkable. It might be even better with an
optimized definition; I
used the modal haplotype that I extracted from the 4 Polish Project samples.
This one does not seem as Polish
as L47P, although those 18 Ysearch samples are concentrated in "Greater
Poland" including Lithuania.
So far, see ISOGG, L47 and L148 are the only two
known branch haplogroups of L48. In
the Polish Project so far (20 July), no one has tested yet for L148, and all
L48 so far at 67 markers are either L47P (previous topic) or L47A. SNP data is not posted on the web, so
I do not know the frequency (prediction probability) of L48 samples that do not
match either L47P or L47A so belong to yet other clades. I also have not searched the web for
the STR values expected for L148. (There
are two samples at 37 markers listed in the Polish Project with L48+, listed as R1b1b2a1a4 by FTDNA, but this is not enough for statistical estimation.). All this will quickly become visible
when FTDNA updates their haplotree. As
of 20 Jul 2010, L48 is a terminal branch at FTDNA, so only administrators have
visibility of SNP test results beyond L48, including L47 and L148. Mayka provided the SNP data that I have documented here.
At the end of July added the following
two I Types to this web document (next two subtopics, M223CE and M253P).
Mayka added these two to the Polish Project web page, based on my recommendation, based on my SBP analysis.
I independently found these two by
analyzing the Polish Project I data. They
were previously known as clusters, hypothetical clades, discussed some time ago by Nordtvedt. Since I’m using 639 samples with 67 marker data as representative of Poland, a small clade at 1% of
the Polish population would be expected to have roughly 6 samples in the
database (70% confidence interval 4 to 10). These two small types have only 4 and
5 statistically independent samples, so each is probably slightly less than 1%.
The STR definitions for these are
available at Haplotypes.xls. PolishCladesUpdate has a link to an Excel analysis file for each of these two
types.
Instructions for Ysearch comparison are below. Here
is the “UserIDs” bar for I comparison:
USEID, WC8JD,
SB6YK
Change USEID to your User ID.
Reminder: These types are calibrated to Polish
data. My definition modal haplotypes may not be optimal for other regions. If you have Polish ancestors, and if
you have all 67 markers, and if you match one
of these (step distance less than 4 for WC8JD - M253P, or less than 16 for SB9YK -
M223CE) I figure there is more than 80% probability that you belong to the corresponding clade. At higher step there is lower
probability that you belong. You
should test the appropriate SNPs (explained below) for higher
probability. If your
ancestors are not from the region around Poland you should follow the links to Nordtvedt’s worldwide definitions to compare your data.
Comment about validity: Neither of these two types forms a
statistically compelling type on Ysearch, although the types seem convincing within Poland. There seem to be clades elsewhere,
particularly in western Europe, with similar STR values, so those others
interfere with M253P and M223CE on Ysearch. I’m using 80% probability in my predictions, and in the case of these two, I estimate the
probability at roughly 10% that either type is not valid as a unique
clade. In addition, even if
both types are valid, men of Polish male ancestry who match at high step close
to the cutoff have up to 10% probability of being descended from a distantly related
clade due to the statistics of STR mutations (for example a descendant of a
recent immigrant from one of those western clades on Ysearch).
General comments about haplogroup I: I1 and I2a are each large in Poland. I2b1 is smaller but significant. I can easily form types for all three
haplogroups, and the STR values do not overlap. Various definitions work
well for those three haplogroups. That
means they are much younger than the ancestral I haplogroup, which experienced
extreme population bottleneck leading to these three haplogroups that are very
well isolated as mountains in haplospace. It appears that only small isolated
populations survived the bottleneck, with an MRCA for each population very distantly related to the MRCAs for the other
populations (I1 vs I2a vs I2b1 vs a few other small haplogroups in I). There is evidence of additional
structure with I1 and I2a - common STR haplotypes (see Nordtvedt). However, with quite a bit of effort I
could not form more types with low SBP. That
means I1 and I2a grew rapidly in population, so that each is relatively
homogeneous in STR values, at least as represented in the Polish Project, which
is the source of my data for my analysis. More SNP data is required to further
subdivide these two large haplogroups with high confidence in the Polish
Project.
My Haplotypes.xls file has other haplotypes defining clusters in the I haplogroup that I
am watching as data accumulates, but only the following two are significant
enough to warrant discussion here:
M223CE. On 31 July I added this Central European
type for I2b1 haplogroup to this web page. This type has been known as a cluster
for a few years. Mayka
points out that Nordtvedt listed it on the web.
It has been known for some time now
that this cluster is positive for the M223 SNP, which corresponds to
I2b1. One of the Polish
Project samples in this type is positive for P95, which is I1b1d. I hesitate to predict P95 for this
type, because individual samples are roughly 80% probability. It does not matter if M223CE turns out
to be P95+ or P95. Either
way, P95 will serve as a test for higher probability predictions. So if you match M223CE you should test
for both the M223 and P95 SNPs to determine your category with high
confidence. I’ll update
this topic when more P95 data is available.
SBP comes out 7.6% for the 5 samples in M223CE in the Polish Project. However, two of these are a family
pair where one encouraged the other to join, so only 4 of these 5 samples
should be used for statistical purposes. SBP calculated on the basis of 5
samples is 10.3%, which is still a high confidence result.
A good signature is (392, 437, 450,446) = (12, 14, 9,11), which distinguishes these
samples from all others in the Polish Project, although exceptions are bound to
show up in the future.
This M223CE type does not seem to be a
unique Polish clade because all 4 samples have step values of 16 or more from
each other, even though there is a gap from step 16 to 24 (relative to the 66
marker modal definition), with no samples in the Polish Project, separating these
samples from all others.
This type is equivalent to Nordtvedt’s
I2b1-Continental. A
definition is available on Ysearch, code 4H6C9, using 62 of the 67 standard
markers plus 8 additional markers (on 31 Jul 2010); this definition differs from mine by
only 7 mutation steps.
M253P. On 26 July I added this Polish type
for I1 haplogroup to this web page. This
type has been known as a cluster for a few years. Mayka points out that Nordtvedt listed it on the web. Marek Skarbek Kozietulski has studied this
cluster quite a bit, since he’s a member. I mentioned this type briefly in my publication, where I was previously
calling it Y type, considering it not high confidencebased on the data
available last year.
It has been known for some time now
that this cluster is positive for I1 (M253) and negative for the known branches
I1a through I1e. So this is
a type within the paragroup I1*, although not all samples from I1* are members of this M253P type.
SBP comes out 6.4% for the 9 samples in M253P in the Polish Project. However, Marek informs me that he had
identified 4 men who matched at 12 markers and actively recruited them to
obtain all 67 markers and to join the Polish Project. That means only 5 of these 9 samples
should be used for statistical purposes. SBP calculated on the basis of 5 samples
is 13.6%, which is still a high confidence result.
I used all 9 samples in my analysis
file at PolishCladesUpdate in order to best estimate the modal haplotype and definition, which are
available at Haplotypes.xls.
The best signature marker for M253P is 392=12; that
marker alone distinguishes the M253P samples from all other I1 samples in the
Polish Project, although quite a few I2 samples have this
value. Exceptions are bound to turn up. That marker alone does not distinguish
worldwide M253P samples on Ysearch.
The best trio signature, (391, 392,
447) = (11, 12, 24) captures 8 of the 9 M253P at step 0. At step 1, (mismatch of 1), that 9th
sample matches, but 1 other sample from I1 and 6 from I2 also match. This demonstrates how short signatures
can be useful but not foolproof. On
Y search that trio does not work well.
Nordtvedt uses a broader definition
for his cluster equivalent to M253P, which I understand he calls I1-ASP, for
Anglo Saxon Polish Pomeranian Prussian. My
54 marker definition at cutoff 4 is narrower, but my definition seems to
capture most of the I1-ASP samples at higher step values. The corresponding SBP at higher cutoff
is not low enough to qualify as a type. The future may provide an SNP defining
a parent clade broader than M253P along these lines, although I doubt the STRs
will score a low SBP value.
Mayka informs me that further M253
work includes testing members for the many SNPs considered equivalent to
M253. If someone shows up
negative for one of those, that will define a new haplogroup in I1.
Here is some interesting speculation
for which I do not have convincing statistical evidence: Marek points out that the sample at
step 4 on Ysearch is Danish, which adds to his evidence that there might be a
related clade in Denmark, perhaps with a node in the I1 tree older than the
node for the Polish clade but younger than the node for the parent I1-ASP
clade.
Meanwhile, if you match M253P, it is a
good idea to confirm with SNP testing: you
should be positive for M253 and negative for the 4 known branch SNPs listed at ISOGG.
N1c1 (M178+) - G Type. New type introduced on 17 Oct
2010. Mayka suggested this one, based on a suggestion by Andrzej Bajor, from his Rurikid Dynasty Project. This type is clearly concentrated in
Lithuania, and Andrzej suggests that at least one member might be a male line
descendant of Gediminas, the medieval Lithuanian Duke. This type has 5 samples very well
isolated in the Polish Project with SBP = 11%. Ysearch has 10 isolated samples with
SBP = 12%. The definition
is available at Ysearch as RGE95, using 52 markers, cutoff 4.
The samples of this type can be extracted
from the N1c1 Polish Project using only the signature (392, 607, 557) = (15, 14, 13).
This type should not be confused with
another G type in the R1a haplogroup.
N1c1 (M178+) - M Cluster. New type introduced on 17 Oct
2010. Mayka suggested this one also. Only
4 samples in the Polish Project. Includes
Mickevius (Mickewicz) descendants. This
is called a cluster because the SBP is not low enough to call it a type in the Polish Project. I
combined the Polish Project data with Ysearch data and found SBP = 20%, marginally qualifying as a type with this
combined data. I’ll wait
for a few more samples before posting and xls analysis file for this one.
Instructions for Use of Ysearch
Link to the site: http://www.ysearch.org. Brief description of Ysearch.
Click on the Create A New User tab, where you can upload your Y-DNA STR data from a number of testing
services. Or, you can type
in your data. You end up
with a “User ID”.
Ysearch has a Research Tools tab to click, where you can type in other User ID’s for comparison.
Cluster Genetic Distance Method; for: P - Pc - Pg - N - K - A - I - B - D -
E - Fa - Fb - H - M - G:
Click here: Research Tools
Copy the following line into the
“UserIDs” bar at the Research Tools page:
USEID, 8U92G, RQK32, 92HEK,
3SEJK, MN8R3, FCUFG, EKVHX, RU8Z8, K49NZ, GNYBG, YQ6D2, EFQM7, 559EE, 24MB4,
ZD29Z
Change USEID to your User ID.
You need to type the Captcha puzzle
for access.
Click on ‘Show genetic distance
report”. You get a table of
results.
Result: If there is a small genetic distance
result (3 or less) for one of these types, you have a high probability of
belonging to that type. There
are more detailed rules available, see the “Polish Project Rules” sheet in the
“Assigner.xls” file in my Update folder.
Reminder: this web page is for men with R1a1a
type Y-DNA. If you are not
R1a1a, these instructions will not produce a matching result, except very
rarely, in which case the result would be meaningless.
The emphasis is on men of Polish male
line ancestry. Just about
all R1a Polish line men are R1a1a. Anyone
from the haplogroup R1a1a from other countries may get good results, but that
may be misleading if there are other types, rare in Poland, not noticed by me,
but with haplotypes that overlap one of these. Many men of Polish male line ancestry
do not match any of these types. For
non-Polish there is a higher probability of not matching any of these types.
This topic was completely rewritten
during Dec & Jan; last
update edit 15 Jan 2011.
This topic provides discussion. Read L260 and M458 News first, for a summary. For
detailed numbers see the following topic.
L260 and M458 are the names of two SNP tests.
Lawrence Mayka is the administrator of the Polish Project. SNP results are not posted on the
web. Most of my SNP data comes from Mayka. Some
of my data comes from Cyndi Rutledge, the administrator of
the R1a Project. Many men join both projects, but of
course many men purchase the L260 or M458 test and do not join either. If you are an administrator of an
FTDNA project (or a project at another database) you may send me the L260 and
M458 results for your project for merging into my analysis, if you wish. Karen Melis, the administrator of the
Zamagur8ie Project, also sent me a few M458 results.
Data with the 67 standard markers is most common in the SNP results because Mayka and I selected
these for the initial tests. In
addition, men who have purchased less than the standard 67 markers are less
likely to purchase SNP tests. This
discussion is limited to the 67 marker data with only brief comments about
those with <67.
Mayka and I purchased many L260 and
M458 tests for Polish Project members, so test results available to me are
biased toward Polish data. Also,
I suppose men who notice my publication and web pages about Polish types are
more likely to purchase the L260 and M458 tests, so even data not available to
me might be biased toward Polish data. At
first we were concentrating on samples that match P type and N type very well,
so much of the data available to me are biased toward P type and N type, of
course. Later we
concentrated on borderline samples that just barely match P type and N type, in
order to better define the borders in STR haplospace. If there are clades from outside
R1a1a1g (M458) that just happen to have STR values that match P type or N type
we will discover them quickly, but not if they are concentrated far from
Poland, and particularly not if they are concentrated in any Eurasian lands
where men do not tend to get DNA tests. If
there are M458 clades with STR values very different than P type or N type it
will take some time to discover them all, because those will require “deep
clade” tests by men without an M458 prediction to do the M458 test anyway. I
have many such “wildcat” results; so
far I have no L260+ or M458+ with STR values very distant from P and N
type. I have comments below
in this topic about the few outlier results a few steps beyond P and N types.
The SNP results do not provide
estimates of population frequency because we are selecting the most interesting
samples for SNP tests. However,
since the SNP tests verify my type classification, my STR types provide
credible frequency estimates. My Results Table is still the best estimate of frequencies in Poland: P type for M458+ L260+; N type for M458+ L260-.
My types are defined by STR values following my mountain method. For samples with all 67 standard STR markers my P type definition uses 46 of those markers; N
type uses 45. The cutoff for both P and N is step 7, which means samples less than 7 genetic distance (step mutations)
from the definition are predicted as belonging to the corresponding type.
To be fair, I should point out that I
was a bit more conservative with my P and N predicted assignment rules 2 years
ago, before the M458 and L260 SNPs were available, and when there were not as
many samples with all 67 markers. Also,
there were fewer known types 2 years ago. Half of today’s P and N outliers would
be missed using my rules from 2 years ago and the others would be placed into
“PK Borderline” and “NK Borderline” categories because 2 years ago I was more
concerned about distinguishing P and N from K type, now known to be
M458-. I no longer use
those PK and NK categories. With
recent data, my current STR based assignment rules are much more accurate for P
and N outliers. I changed
the P type definition last October.
I cannot define P type as exactly
equal to L260, nor can I define N type as exactly M458 minus L260, because the
types are defined by STR correlations. The
outliers may be statistical, due to the luck of random mutations, particularly for
P type with only 2 outliers so far (15 Jan 2011). I find that unlikely for N type,
because the N branch STR distribution seems to have a non random tail extending
to many outliers. It is
possible that N branch outliers represent very small clades (perhaps only one clade) with old nodes in the Y-DNA tree. However, any particular outlier at or
beyond the N cutoff cannot be assigned with confidence to a subclade of
N. This is the reason I use
the word “branch” instead of type for outliers, because I cannot be confident
they all belong to the same young clade, as opposed to multiple young clades
with old branches - with old nodes in the Y-DNA tree
However, those N type outliers provide
confident assignment rules. At
the N cutoff step N=7 all 4 samples in the Polish Project have been tested
M458+ confirming N branch. At
the next step N=8, 3 of the
P type and N type are very well
separated from each other. Within
P type, there is only 1 sample with steps N=P+5; all others are N>P+5. N type is more diffuse in STR values
than P type. For N<6
there are 3 with P=N+5. The
most ambiguous N type sample has N=7 (cutoff) P=8, and that one has been
evaluated M458+ L260- confirming that samples marginally N type are really N
branch. There are 3 others with N=6 or 7 and N<P<N+4; 2 of them are confirmed M458+ L260-
and the other is M458+ but not tested for L260 yet. The most distant sample has N=10 P=9
and it is confirmed in the N branch, M458+ L260-, again providing the insight
that distant STR samples with P step about equal to N step tend to fall into
the N branch. (Again, this
is for Polish Project samples that do not fit another known type). Of course, we expect someday to see
exceptions, just due to the luck of random mutations.
There is one sample with P=9 N=11, but
that one has an recLOH mutation that scores 4 steps at the DYS464 set. This is really only one mutation, so I
manually adjusted the step to P=6 on this one.
For P type, the closest M458- sample
has P=7 (cutoff); it fits I type; this is the sample that originally
sparked my interest in P type. A P=8
M458- sample is assigned to K Borderline. A P=9
N=9 sample is the closest M458- sample that does not fit any known type, so is
assigned to the Remainder category.
Borderline comments: In the Polish Project we use borderline categories for samples that have 50% to 79% confidence of belonging to a
haplogroup or type. For P
and N type samples with 67 markers, borderline means the SNP test has not been
performed. With SNP
results, samples are placed in the corresponding P or N type, with the
understanding that outliers may in fact belong to closely related clades, as
explained above.
Remainder comments: I use remainder categories for samples that have less than 50% estimated probability of
belonging to any known type. Until
recently we distinguished between the Rx458 category for samples not tested for
M458 (and not positive for L260) vs the R458- category for samples that have
been tested negative for M458. Today,
all samples distant from all known types have been coming out R458-, so the
Rx458 data has been merged into the R458- category.
During 2010 I used a R458+ category
for N branch outliers, to distinguish outliers, which might not be true N type
members. However, the
distribution of N STR values is continuous, with no objective cutoff for N type
vs N branch, so the R458+ distinction was dropped for now.
This discussion concentrates on
samples with 67 markers for clarity. There
31 with only 37 markers and 2 with only 12 that have SNP results. I watch these for obvious
anomalies; none
yet. Analysis has lower confidence with fewer markers.
Summary of results: P type and N type are very well
isolated in STR haplospace. They are well isolated from M458-
samples and even more isolated from each other. Roughly 90% of the M458+ samples
cluster into the two STR types within which I can make future SNP predictions
based on new STR data with virtually 100% confidence. The roughly 10% remainder have STR
values near the cutoffs for the types, mostly N type. Future STR predictions for these can
be made with more than 50% statistical confidence (up to 100% probability based on the few data available so far) because most of these that do
not fit one of the other known types do come out L260+ if closer to P type and
M458+ otherwise. It is
possible that some of these outliers belong to small clades (perhaps only two
or three) that have older nodes in the Y-DNA tree.
Age (TMRCA) of haplogroups is uncertain due
to a number of caveats. That said, N type seems to be about 2,000
years old and P type seems to be about 1,500 years old. Those estimates can be up to a factor
of 2 incorrect, as discussed in my caveat topic. The ages of L260 and M458 are
particularly uncertain because the calculated ages are dominated by P and N
types, which are quite young. The SNPs may be much older, for all we
know. The outliers in the P
branch are too few to have significant effect on the calculated age of P
type. It is possible that
the N branch is really two (or more) types that are just as young as P; the calculated N age in such a
situation would come out older. Ng type provides preliminary evidence of a hypothetical subtype of N, but Ng is
too small and too close to N to affect the calculated age of N.
What does all this mean? There are a number of
explanations. Here is the
explanation that seems simplest to me: The
R1a1a1g (M458) clade seems to be thousands of years old. It may have expanded into a large
population long ago. The
members of this clade diffused into a wide distribution of STR values over the
millennia. Then there was a
severe population bottleneck followed by a rapid population expansion, or multiple bottlenecks
followed by multiple expansions. The
living members of M458 descend from only a few men who each lived near the
beginning of the most recent population expansion. Almost all living M458 men descend
from just two of those men: the
N type MRCA and the P type MRCA. A
low percentage of living M458 men perhaps descend from other MRCAs who lived at
roughly the same time as those two, as evidenced by the outliers in the N
branch SNP data available to me today.
L260 and M458
Test Results; Details
This topic was completely rewritten
during Dec & Jan; last
update edit 15 Jan 2011.
Number of samples:
51
L260 Polish Project
32 L260+
19 L260-
8
L260 R1a Project, counting only those not in the Polish Project
2 L260+
6 L260+
59
L260 Total
34 L260+
25 L260-
154
M458 Polish Project
83 M458+
71 M458-
43
M458 R1a Project, counting only those not in the Polish Project
9 M458+
34 M458-
7
M458 Zamagurie Project, not in lists above
7 M458+
204
M458 Total (sum from above)
99 M458+
105 M458-
263
Total SNP test results (sum from above)
213
unique samples (210 different men)
180 have all 67 standard STR markers
31 have the 37 standard set
0 have the 25 standard set
2 have the 12 standard set
P type summary at 67 markers:
34 P<6 predicted P type all
confirmed
7 P=6 predicted P Borderline all
confirmed P type
1 P=9, but P=5 or 6 if corrected for recLOH, so predicted P type; counted as P<6; confirmed L260+
42
P type; so far, all samples below the cutoff 7 came out L260+, confirmed P type
1 P=7 (cutoff for the definition) P
branch outlier confirmed L260+
1 P=8 P branch outlier confirmed
L260+; this one from Czech
Rep. is not in the Polish Project
2
P branch outliers; so far,
all SNP data samples with P<9 are either P type or fit well to another type
so far, no L260+ with P>8
N type summary at 67 markers:
25 N<6 predicted N type all
confirmed
6 N=6 predicted N Borderline all
confirmed N type
31
so far fit N type, all confirmed
4 N=7 (cutoff) predicted N Borderline
all confirmed M458+ N branch
There are no samples from other types
at N<8
So far, all samples below with N<8
came out M458+ L260-, confirmed N branch
4 N=8 N branch outliers; all confirmed M458+
8
N branch outliers N<8 100% probability predictable, >50% confidence
So far, all SNP data samples with
N<9 are either N type or fit well to another type
2 N=9 N branch outliers
1 N=10 N branch outlier
3
with 50% predictability but no confidence, explained below
P type Details; samples that have all 67 markers sorted by P step:
34 P<6 solid P type (P<6 means
<6 mutation steps from P type definition)
3 N=9 all solid P type well isolated from N
5 N=10
26 N>10
16 of the 34 are M458+, L260+; confirming P type not N type
8 are L260+ not tested for M458,
assumed to be positive, confirming P type
10 M458+ not tested for L260 -
predicted positive
7 P=6; 1 step below cutoff; would be predicted P Borderline prior
to SNP evaluation; all 7
are M458+
4 are L260+, confirming P type
3 not yet tested for L260 probably
most of these will be positive, now predicted P type
These represent all the Polish Project
samples at step 6, 1 step below the cutoff, because these were selected for
M458 evaluation soon after M458 was discovered. So step 6 is not as common as it seems
in this SNP analysis.
2 P=7; cutoff; first step just beyond P type
predictions
1 P branch outlier predicted P
Borderline; confirmed
L260+. From Bohemia.
1 predicted I type, verified M458-,
not in the P or N branches
P=7 is very rare. By the way, this sample is my maternal grandfather.
5 P=8; 1 step beyond cutoff; 2 steps beyond P type
1 M458+ L260+ P branch outlier; not Polish Project; R1a project from Hostacov CR
1 predicted K Borderline; result M458- confirms not P or N
type; still predicted K
Borderline
3 N<=P considered N branch; details
below
9 P=9; 3 steps beyond P type
1 N=11; M458+ L260+ This one has
recLOH at 464, contributing 4 steps, so I consider this equivalent to P=6, so I
count it as predicted P type, not an outlier. This is marginal, since it could be
argued that the recLOH mutation may have happened after a 1 step mutation at
464 for all we know, making 2 steps, placing this sample an outlier at the
cutoff 7, so my decision to predict him P type is arguable.
1 N=12; K=1; predicted Fa type
(subtype of K) confirmed M458-
7 N<(P+2) considered N branch;
details below
123 P>9 none are L260+; 18 are L260-
180 total with 67 markers, sorted here
by P step
N type Details; samples that have all 67 markers sorted by N step:
25 N<6 solid N type
all 25 are M458+
0 L260+
3 of the 34 are M458+, L260-; confirming N type not P type
3 P=9; N<5; match N type much better than P type
29 P>9
6 N=6; 1 step below cutoff; were predicted N Borderline a couple
years ago
all 6 are M458+
2 are L260-; the other 4 are predicted L260-
1 of the 6 is P=8 just beyond cutoff, but
P is a tighter cluster, so this would not be predicted P, and this one came out
L260- as expected
1 of the 6 is P=9, L260-
4 P>9
so all 6 are well isolated from P type
4 N=7; cutoff. These represent all the Polish Project
samples at step 7, because these were selected for M458 evaluation soon after
M458 was discovered. So
step 7 is not as common as it seems in this SNP analysis.
all 4 are M458+
2 are L260-; the other 2 are predicted L260-
These are predicted N Borderline prior
to SNP evaluation
5 N=8; 1 step above cutoff; 2 steps
beyond the original N type definition
4 M458+; predicted N Borderline, now
classified N type
1 P=8,10,10,13; K>6; fit no other known type
1 is Austria, not Polish Project
1 M458-, P=11, K=3 predicted K type,
M458- result confirms K not N
9 N=9; 2 steps beyond N cutoff
3 predicted N Borderline do not fit
any known type
2 M458+ N Branch outlier; P=11,16
1 M458- Assigned to R Remainder
category; P=9, K=7
even at N=9, 2/3=67% probability N
branch for samples that do not fit other known types
3 predicted D & G types verified
M458- not M458 branch
3 P<5 P type analyzed above all 3
are L260+
10 N=10; 3 steps beyond N cutoff
2 do not fit other types
1 M458+ L260- N branch outlier; P=9;
DYS573 null - discussed in previous topic
1 M458- Assigned to R Remainder
category; P=16, K=8
3 fit other types; D, DB, & K,
predicted M458-; all
confirmed M458-
5 P<5 P type analyzed above 4 are
L260+ 1 not L260 tested yet
121 N>10
36 P type discussed above
3 <(N-2) other types discussed with
P sort above
75 M458- predicted other types,
neither P nor N
7 N.17 M458- do not fit any type; R
Remainder category
180 total with 67 markers, sorted here
by N step
This is a new topic, written 17 Jan
2011.
DYS385a. The single STR marker called 385a is by far the best signature for predicting P type vs N type. All
34 samples with L260+ result so far have the value 10. All 25 samples with L260- result so
far have the value 11.
Mayka also independently noticed this and mentioned it to me.
Usually, a signature with more STR
markers predicts better. In
this case, discriminating P (L260+) from N (L260-), 385a=10 predicts best by
itself. No signature with 2
or more markers discriminates better. In
fact, just 385a=10 works as well as the 46 marker P type definition.
This seems amazing, but is not
entirely unexpected. STR
markers have lower mutation rates at lower values, and step down mutations are
less frequent than step up. Since
N type has mostly 385a=11, step down to 10 should be less often than step up to
12.
The mutation rate of 385a=10 in P type
(L260+) seems very low. At another of my web pages I postulate a rare SNP in the middle of a long STR chain to explain a
low mutation rate, but such a postulate does not seem necessary in this 385a
case because of the short STR chain value. For the lower rate at lower STR
values, I provide a reference to Whittaker (2003) in my publication.
We can predict that future M458+
samples will be L260+ if 385a=10 and L260- otherwise. The probability is 100%. Exceptions are zero out of 59 L260
results so far. I figure
the confidence of this prediction at 94%: Poisson
94% confidence interval for zero is the interval zero to 3.5; (1-3.5/59) = 94%. In other words, I am 94% confident
that 3 or fewer samples out of the next 59 L260 measurements in the Polish
Project will be exceptions to this new rule - that 385a=10 means L260+. Exceptions will be found eventually,
of course, due to rare independent mutations from 11 to 10.
In the Polish Project, all 96 samples
assigned to P type and all 15 samples assigned to P Borderline have the value
10 for 385a. There are 89
samples assigned to N and N Borderline. Only
7 of these have the value 12 for 385a; the
other 77 have the value 11. In
this case, predicting P type based on 385a=10, zero exceptions out of 100
samples, provides 97.8% confidence.
I postulate that 385a has only a
slightly higher mutation rate in the N branch, at value 11. I postulate that those 7 N branch
samples with 385a=12 belong to 2 or 3 subtypes in the N branch, 2 or 3
independent instances of a mutation from 385a=11 to 12. Most of these belong to a hypothetical
Ncm type. The data is not
sufficient yet to provide statistical evidence along these lines.
385a does not work quite that well for
discriminating P type from all of R1a. Among
the 91 M458- samples not tested for L260 there are 2 with 385a=9 and 4 with
385a=10. None of those are
expected to be L260+ because L260 is a subhaplotype of M458. The 385a marker is still the best
single marker for extracting P type from a full R1a database, including M458-
samples from outside the M458 (P+N) haplogroup. However, in this case, using 2 or 3
markers works better, and of course the definitions (46 markers for P, 45
markers for N) work much better than any short signature.
A few samples with 385=(10,10)
represent a hypothetical subtype within P. I call this Pk. I’ll discuss it more if and when there
are enough samples for statistical significance.
Other signatures. Table 3 of my publication provides other signature markers. DYS572=12 continues to be 2nd best for
P type. DYS 537 continues
to be best for N type.
My R1a page has a handy 3 marker signature table. I announced this more than a year ago,
as a handy prediction signature for the dominant types in R1a, using only the
first 25 markers most common on the internet. It still works well. That signature uses (385a, 439,
447). The values for P type
(L260+) are (10,10,23). The
values for M type (M458+ L260-) are (11,11,23). The values for K type (M458-) are
(11,10,24).
37 Marker Network
Lawrence Mayka (independently, March 2007) constructed a “median joining network” Network for the 37 marker samples of the Polish Project. This network supports the definitions
of the P & N clusters, and of the A subcluster. The P cluster is the left side of
Mayka’s network; N is the
top branch, and A is a small branch on the lower right.
29 March 2010 correspondence: I mentioned Russian sites for R1a clusters in my publication. It’s not easy for me to figure out
which of those clusters correspond to my types. Mayka worked out a correspondence on 29 March, warning me that the
correspondence is not exact. Some
of the Russian clusters are broader than my types; some are narrower. Here are Mayka’s findings:
My
Type code vs Russian cluster name:
A Ashkenazi Jewish
B Western Eurasian
C Old European
D Baltic - Carpathian
E Northern Eurasian
F Central Eurasian
G Northern European
H Western Carpathian
I Northern Carpathian
N Central European
P Western Slavic
19 Sep 2010 update: A nice tree display of the Russian
subdivision of R1a is at www.r1a.org. Robert Sliwinski brought this site to
my attention.
My opinion: R1a cannot be highly subdivided with confidence based on STR data. This web site
of mine is dedicated to estimating the confidence of each type that I study. I try
to indicate which types are speculative. Even for the types with high
confidence, the location of the nodes in the R1a tree will be uncertain until
corresponding SNPs are discovered. These
Russian clusters, apparently byKlyosov, have plus / minus values for
accuracy of TMRCA ages that are far to small, because there are serious caveats associated with systematic statistical uncertainties.
Here is a summary of terms (in
boldface) that I defined for my “Mountains in Haplospace” method. For more explanation, see the fall issue of JoGG. By haplospace I
mean multidimensional sets of STR values; each haplotype is a point in haplospace.
A cluster qualifies as a type if the graph of step frequency (number
of samples at that step) vs step looks like an isolated mountain. The step is the
genetic distance (mutation count) from the modalhaplotype of the cluster. I
use the method of Ysearch to calculate step. The cutoff is the next step just beyond the
mountain. A good type has
low step frequency in a “gap” of step values including
the cutoff (only the cutoff for a gap of 1). In other words, the cluster forms a
mountain at step values less than the cutoff, separated by a gap from the rest
of the database (the parent haplogroup usually) at higher step numbers.
The Statistical
Background Percent (SBP) is
an objective measure of the quality of the type. Low SBP is taken as evidence that a
type corresponds to a clade that may be verified as a haplogroupin the future by an SNP (yet to be discovered). Larger
types with lower gaps have lower SBP. SBP
is intended as an estimate of the background percent
of samples in a type that really do not belong to the corresponding
hypothetical clade. SBP is
increased to account for the estimated probability of outliers from other
clades. An outlier is a sample that has very unusual STR
values due to the luck of mutations. SBP
is also increased to account for the estimated probability of small foreign
clades that just happen to
have the same STR values but are not closely related to the type. The SBP is also increased to provide
the rough equivalent of the maximum in a confidence interval. Small
sample counts have wide confidence intervals. So larger types (more samples)
automatically get lower SBP. For
a valid clade, SBP should decrease with time as data accumulates in a
database. A very well
isolated clade will have a low SBP even with only a few samples. SBP < 5% is very rare - a very well
isolated type, very likely to be a clade. SBP < 25% is good enough to be
published. SBP < 50% is
a type worth watching as data accumulates with time. The SBP equation (available as an Excel worksheet in thetools) produces SBP > 100%
for clusters that do not look like mountains. The number of markers in the definition should be chosen to provide as small an SBP as possible; my Excel tools provide automatic rank of markers
as an aide; human judgment
can be used to include or exclude markers with obvious problems. A signature is
a small set of markers that rank best, convenient for publication of a type,
and for simple demonstration of the correlation of STR values.
I use the word “type”
to mean 1) the hypothetical clade, and 2) the associated cluster of data, and 3) the modal haplotype, and 4) all possible haplotypes that differ from the modal haplotype by step less than the cutoff. The definition of
a type is the modal haplotype plus cutoff. The definition uses only those STR
markers that provide the lowest SBP, but the definition uses as many STR makers
as possible. The definition
of a valid type may change slightly as data accumulates.
Here are
some common terms (in boldface) for genetic genealogy. I did not define these, although I use
them in a restricted sense: A marker (also “locus”, plural loci) is a DNA
location for an SNP or STR or other kind of mutation. A haplotype is
a set of gene values at any number markers, here restricted to Y-DNA STR
values. I use the word sample (plural samples or data or database) for the Y-DNA STR values from one man. A sample is also commonly called a
haplotype, but I avoid calling a sample a haplotype to make it clear that a
haplotype may or may not be present in a particular database of samples. A clade is a
general term for common descent, so an SNP haplogroup is one kind of
clade. I use the word clade
in general, when meaning a Y-DNA clade that may or may not be a defined
official haplogroup. All types have associated hypothetical clades, but most clades cannot be isolated
as types with low SBP. A cluster is a set of samples with similar STR
values. All types have
associated clusters but not all clusters are associated with types. The modal value for
a marker is the most common value in the cluster. The modal haplotype is
the set of most common values, usually the most common haplotype in a
cluster. Many people use
the adjective “modal” as a noun, meaning “modal haplotype”; so do I; I tried to avoid that in this web
document.
Not all Y-DNA STR data separates into
types because the distribution of STR values tends to be continuous. A type corresponds to a clade that
experienced a population bottleneck - isolation or migration or very rapid population growth.
Probability Minimum 80% for
Polish Project R1a Assignments
This topic was updated 29 Dec 2010.
See Polish Project Assignments for a brief overall explanation of how assignments are done. This topic provides more detailed
discussion. This topic
focuses on the R1a categories, but most of this discussion obviously applies to
other categories.
Each sample (individual man) is assigned to a category. Many categories are known haplogroups or paragroups. Haplogroups are defined by SNPs, but not all haplogroups are
supported byFTDNA assignments, which may cause some confusion.
Some categories are types, which are hypothetical
haplogroups. Borderline and
cluster categories are discussed near the bottom of this topic. Click on Remainder and Unassigned for discussion of those two categories elsewhere.
The assignment guideline is at least 80%
probability for each individual sample. Using an 80% minimum, most assignments
are better than 80%, of course. So
the average probability for a category is higher than 80%, and the average
varies by category depending upon how many samples are marginal near 80%.
For haplogroups, “80%
probability” means that if a large number of samples with 80% probability were SNP tested, about 80% of them would test positive for the haplogroup into
which they were predicted. Probability
is determined by correlating STR values with samples that have been tested for that SNP.
Some assignments are 100% probability
- samples with positive SNP test results, assigned to that haplogroup, and not
given an extended assignment. Actually,
there is no such thing as 100% because the genetic test might be in error, but
it seems from experience that testing errors are much lower than 1%.
I arrive at probabilities with a
combination of calculations and educated estimates. This topic is my explanation.
Confidence is a separate topic,
related to probability. Confidence is next, below.
I figure probability as a decreasing
function of step from a modal haplotype. My assignment rules are step distances
at which I figure 79% probability. If
a sample matches the modal haplotype at less than the 79% step distance, I
assign that sample to the corresponding haplogroup or type or other
category. In practice it’s
complicated. I use an Excel file for assignment. You can view the file atwww.gwozdz.org/PolishCladesUpdate/Assigner.xls. That may not be the current
version. In that file the
“PolishProjectRules” sheet has the list of rules for human reading - next to
the coded logic functions for Excel. If you are a Polish Project member you
can find your kit number and view your step to each category in the table -
“Modal Calculator” sheet.
The following paragraphs explain how I
figure probability for types. This is not something I proved in my
publication, but it seems to me that my publication makes it reasonable. I hope you the reader find the
following method reasonable. I
expect this method will be proven with time as most of my predicted types are validated.
If a type has 90% probability of being
valid and a particular sample has STR values that match the type with 90%
probability, those two numbers get multiplied for net probability. That particular sample has 81% net
probability of validity, and 19% probability of invalidity. I do not actually calculate
this. This paragraph is a
conceptual explanation introducing the explanation in the following paragraphs.
My publication has detailed discussion of my statistical method for types. Briefly, I use SBP as a quality measure. SBP
is a measure of the background - the percent of samples that match the type but really do not
belong. For example if SBP
= 15%, that means 15% is a measure of how many samples within the type (step less than cutoff) really do not belong
to the type. For this
example, a typical sample in the type has 85% probability of really belonging
to the type.
It is not possible to calculate the
probability that a type really is a clade that will be validated some day by an SNP not yet discovered. Although 100% minus SBP is not the
probability of type validity, 100% minus SBP is closely related to
validity. Certainly a type
with high SBP has low probability of being valid. Certainly a type with SBP less than
15% has high probability of validity.
SBP is a high calculation, designed
for roughly 70% confidence interval, with additional increase for many statistical reasons
explained in my publication. That’s why I call it “Statistical
Background Percent”. This
statistical increase is small for small SBP and larger for larger SBP. The way SBP is calculated, it goes
over 100% for type candidates with high background; SBP should not be used over 50%.
The best estimate for background
percent is lower than SBP. However,
as explained a few paragraphs above, the net percent of invalid samples (net
invalidity) is higher in the cluster of a type, because of the unknown
probability that the type itself is invalid as a whole. It is convenient for me to assume
these two considerations cancel each other. I use SBP as my estimate for the net
background percent of invalid samples in a type.
A sample that matches the modal
haplotype has close to 100% probability of belonging to the corresponding
type. For a type with a
high cutoff, this is true even for a sample a few steps away from the modal
haplotype. The reason is
that the vast majority of haplotypes in a type are at the highest step numbers,
so that is where most of the background is. This is explained in the discussion of
Table 1 on page 145 of my publication.
So here is my method: I figure an assignment rule “step <
S” to assign samples, where the samples at step S and greater, equal to about
SBP percent of the type cluster, do not get assigned.
This finishes my brief justification
for using SBP as a guide for assignment. More discussion of details:
There are other calculations in
addition to SBP, for example haplogroup correlations mentioned above.
Another is the calculation of
correlations for 37 marker rules, which are similar to haplogroup
correlations. Using 67
marker data for a type, the 37 marker data for those samples provide
probabilities that other samples with only 37 markers belong to this same type.
After I do a particular calculation many
times, I feel confident glancing at new data and making quick estimates for new
rules if the number of samples does not justify detailed calculation.
Let me repeat what I said above: I arrive at probabilities (assignment
rules are 80% estimated minimum probability) with a combination of calculations
and educated estimates.
Mayka, who does the assignments for most
categories other than R1a, does not use my calculation methods, but insofar as
he uses his experience to judge STR correlations, he is really performing
estimated correlation calculations.
When a probability is judged close to
the 80% minimum for assignment
based on STR correlations (step close to the rule limit), there are a number of
additional factors that can be considered. The following paragraphs are
examples. More examples are
in my publication. Mayka
uses similar considerations for assignments:
Geographic concentration. P type is an example. P type is concentrated in
Poland. I considered P type
as more likely valid because it is geographically concentrated, before it was
validated by an SNP. Back
then I considered a Polish family name associated with a sample as marginal
additional evidence of belonging to P type. Today that consideration applies to a
sample that marginally matches the P type haplogroup with STR values but has
not been measured for the L260 SNP.
Ethnicity. For example, there are a number of
haplotypes known to be common among Jews, so a Jewish name associated with a
sample is marginal additional evidence that the sample belongs to a
corresponding haplogroup or type.
Stragglers. We tend to avoid categories for only
one or a few samples, so if one or two samples have 70% probability as a best
estimate it makes sense to adjust the rule a little looser so that the rule
picks up those few samples that do not quite fit, rather than create a
borderline category (discussion below). Conversely,
it makes sense to be a bit stricter for type assignments if a borderline
category is available.
67 markers. We are marginally more liberal with
assignments using the full 67 markers and marginally stricter for samples with
fewer, because those with fewer can get more accurate assignments by procuring
the remaining markers.
Men with closely matching STR should
be classified together, particularly if the family name is the same.
We avoid changing assignment rules too
often, so some assignment rules may remain in place for a while even after new
data has provided slightly better rules.
For a valid type SBP comes down as
data accumulates, with better statistics. I avoid introducing a new small type
with SBP above 25%, because I expect it to improve with time. Technically, SBP = 40% means 60% of
the samples can be introduced as a new type category, but I prefer to wait a
few months for more data, so that a new type is substantial at introduction.
For some types, many of the samples
near the cutoff have already been assigned with high probability to another type. So those assigned samples should not
be included in the SBP calculation. K type is an example. Although
my published SBP for K type is 26%, many samples at the cutoff are assigned
with high confidence to other types, including many P type that have tested
positive for the L260 SNP. The true background for K type is much
less than 26%, although I have not taken the time to do an adjusted SNP
calculation.
We do not wish to be dismissed by
others with experience evaluating STR data. On the other hand, we do not wish to
have others point out that samples are being left without obvious
assignment. I suppose the
goal should be that the number of people complaining that assignments are too
liberal turns out to be about equal to the number of people complaining that
assignments are too conservative (people with experience evaluating STR data
who have read and understood my documentation here).
A person who assigns samples to
hypothetical haplogroups based on STR values acts like a bookie who provides
advance estimates for gambling odds, using a combination of calculations,
educated guesses, and intuition. A
bookie’s estimates are usually tested by reality very quickly. Probabilities of an STR estimator may
not be verified or falsified by a new SNP for years. You need to be skeptical of STR based
predictions. In the past, a
number of STR based assignments have been shown wrong by new SNP
discoveries. This long web
document is provided so you can read as much as you wish about our (Mayka’s and my) methods, judging for yourself the
reliability of our probability estimates.
I use Borderline categories when a significant number
of samples have 50% to 79% probability for one haplogroup or type, and have
less than 20% probability for any other haplogroup or type that I know
of. The 80% rule does not
apply to samples in a borderline category, although it would be correct to say
those samples have minimum 80% probability of belonging either to the
corresponding type or to an undiscovered type with similar STR values, as
opposed to belonging to a specific known type or to another borderline
category.
For R1a, I also use a Remainder category, and an Unassigned category for samples with fewer than 67 markers.
The Polish Project occasionally but
rarely uses a Cluster category, which is similar to a borderline category, except the category
itself has less than 80% probability of corresponding to a valid clade, so the
80% rule does not apply.
Borderline, Remainder, Unassigned, and
Cluster samples also have their FTDNA assignment which is either 100% (green) or 99% (red).
Confidence and Probability; More Statistical Comments
{This
entire topic needs rewrite. This
is an old version. I moved
the probability discussion to a new topic, above. Much of this topic is OK as is for
explanation of “confidence”, but most is redundant. Watch this space for a
rewrite.}
See the Assignments topic for a brief discussion of Polish Project assignments. The previous topic explains how I
figure minimum 80% probability for assignments of individual samples (men), for the Polish Project. My publication explains my statistical methods. There
is a summary of my mountain method above.
This topic is about confidence. I’m not trying to be statistically
exact here. I’m just trying
to explain a point that may not be obvious to everyone: Confidence is not the same as
probability. For example, I
could calculate a 90% probability of no rain today based on data showing that
on this day in this place, over a large number of years, it only rained on this
day for 10% of the years. However,
if I can see storm clouds in the distance, I have much less than 90% confidence
of no rain.
My minimum 80% probability rule for assignments also means minimum 80% confidence. I give an example in the next
paragraph of one method to calculate confidence. However, most of my confidence for
assignments are based on educated estimates, not exact calculations.
Confidence interval example: By 80% confidence I mean 80% is the
lower number of the 80% confidence interval. For example, 80% confidence might mean
that the actual probability is 90% but the 80% confidence interval is 80% to
96%. In the following
paragraphs I
{continue
the edit here}
As an example, consider a situation
where 10 samples match a type with an STR test. Suppose there
is a definitive SNP test available, and 9 of those 10 samples test positive for the SNP, and
1 negative. That means 9 of
the 10 really belong to the haplogroup and that 1 mismatch must come from a different haplogroup that matched
the STRs by the luck of mutations. Next,
consider a new sample that matches that same STR test. What is the confidence that the new
sample will pass the SNP test for the haplogroup? The probability is 90% because we know
that 9 out of 10 previous samples like this matched the SNP. However, 1 out of 10 is a very small
sample. As explained in my publication, I use Poisson
statistics for quick calculation of confidence interval. Poisson statistics is simple to
calculate inExcel. My tool Type.xls has an “SBP” sheet with a set of cells for quick Poisson
calculations.
80% confidence interval of 1 is 0.11
to 3.89, which is 11% to 38.9% out of 10, so subtracting from 100%, the 80%
confidence interval of a match comparing to 9 out of 10 is 61.1% to 89%; that lower number 61.1% means the 80%
confidence ranges to lower than 80%, so net confidence is lower than 80%.
70% confidence interval of 1 is 0.16
to 3.37, which is 16% to 33.7%, lower number 66.3%; net confidence lower than 70%.
60% confidence interval of 1 is 0.22
to 2.99, lower number 70.1%; confidence higher than 60%.
67.3% confidence interval of 1 is 0.18
to 3.26, lower number 67.4%. So
that’s my one number: 67%
confidence.
In other words, if 9 out of 10 samples
that match an STR also match the SNP test, we have at least 67% confidence a
particular future sample matching the STR test will also match the SNP test.
For 18 out of 20, the probability is
still 90%, but a similar calculation shows 75% confidence.
For 36 out of 40, the probability is
still 90%, but a similar calculation shows 80% to 96% confidence interval,
minimum 80% confidence, which is my example that I started with above. These calculations take less than a
minute using my Excel cells.
Statistical Background Percent: SBP. I use SBP as a net confidence estimate
for the background (samples that match the STR values but really do not belong to the clade of a type). My publication does not go into the details
of confidence intervals. That
is the purpose of the explanation here in this topic. SBP is my estimate for the net
statistical confidence before any SNP has been discovered to validate a
hypothetical type. 100%
minus SBP is my estimated confidence that a sample in the mountain cluster belongs to the corresponding hypothetical clade.
A mountain cluster corresponding to a
type might include outliers from other clades, or might include foreign clades. These and other caveats associated
with STR prediction are discussed in detail in my publication, where I point out that
the confidence for all such caveats cannot be calculated. I estimate the background by using the
low frequency of samples in the gap as representative of the background throughout the haplospace neighborhood. My SBP
formula (available in the tools) includes an increase
in SBP to account for all such caveats.
Part I of my publication
explains: “Much of the
background is probably at the last step of the mountain, just before the cutoff. Much of the remainder is probably at
the previous step, much of the remainder after that at the previous step,
etc.” My Part I Table 2
justifies this by demonstrating how the number of possible haplotypes increases
very rapidly with step. In
other words, SBP is a good worst case overall estimate of background percent within
a type, but background percent is very low at step zero and increases rapidly
with step. My publication
does not provide a formula for background vs step and in fact I have not
derived an formula. For
assignment of samples, I estimate the confidence vs step in a manner to provide
a rapid decrease in confidence near the last step, in a manner to produce
overall confidence roughly equal to 100% minus SBP. Step zero is my rough estimate that
the type is a valid clade, since the step zero samples belong to the clade with
very high probability if the type is valid.
Some outliers from the type
statistically fall within or even beyond the gap, so confidence is not zero at
the cutoff.
Confidence also depends upon the size
of the gap. A wide gap with
zero samples means even samples in the gap near the mountain have reasonable
confidence percent.
Estimates vs Calculations vs
Adjustments: A
person who assigns samples to hypothetical clades based on STR values acts like
a bookie who provides advance estimates for gambling odds, using a combination
of calculations, educated guesses, and intuition. A bookie’s estimates are usually
tested by reality very quickly. Probabilities
of an STR estimator may not be verified or falsified by a new SNP for
years. You need to be
skeptical of STR based predictions. In
the past, a number of STR based assignments have been shown wrong by new SNP
discoveries. This long web
document is provided so you can read as much as you wish about my methods,
judging for yourself the reliability of my estimates and net probabilities.
The first confidence interval example
above, confidence of STR predictions calibrated to SNP data, can be pure
statistical calculation without any estimates. However, judgment is involved. Even such SNP predictions should be
split into parts based on the step value of the samples within a type. However, if split down to individual
steps, the statistics are very poor due to small sample size, so steps are best
combined in batches. For
the first data from a new SNP it is necessary to combine all the steps, so the
predictions benefit from an estimated confidence by step. So the judgments and calculations can
get quite complicated, and often I just estimate the confidence from experience
rather than do the calculations every day as data comes in.
I avoid changing assignment rules
often, so some assignment rules remain in place even after new data has
provided better rules.
My standard is 80% confidence, but I
avoid introducing a new type until the confidence is a bit higher, because a
new 80% confidence type would provide only a few samples at step zero on the
day when enough data has accumulated. After
waiting for more data, I tend to bend the guidelines a bit below 80% confidence
in order to introduce more samples with a new type. Also, if I notice an individual coming
out at 75% when I’m updating rules I’ll tweak the rule to include him.
I tend to be generous in estimates for
samples with all 67 markers, and I tend to be conservative with samples having
fewer than 67. I update the
rules more often at 67. After
all, samples with fewer than 67 markers can get much better confidence by
ordering more markers, and 67 is the most available as a standard commercial
test.
I do not look forward to a man feeling
slighted when he is not assigned to a type that is a reasonable fit to his STR
data. On the other hand, I
do not wish to be dismissed by others with experience evaluating STR data, so I
try to be conservative in my probability estimates that particular clades in
fact exist. I will have
achieved my goal if the number of people complaining that I assign too
liberally turn out to be somewhat greater than the number of people complaining
that I am too conservative (people who have read and understood my
documentation).
Naturally, my confidence changes from
month to month as more M458 and STR data accumulates, for better statistics.
Assignments at fewer than 67 markers: There are two ways: Some types have low SBP and seem 80%
valid using 37 or only 25 markers, at least for samples at low step, so samples
can be directly assigned.
Second way: I check for correlation using the
samples with 67 markers to see which percent of samples at given genetic
distance using fewer markers end up in the corresponding type at 67
markers. The confidence of a sample at fewer markers is that confidence
multiplied by the corresponding confidence at 67 markers.
This topic was updated 29 Dec 2010.
I look forward to the discovery of SNPs validating more than 80%, probably
more than 90%, of my R1a Polish Project type assignments.
I introduced P, N, and K types in the Fall of 2007, publishing this web page 6 Dec of that year. I did not predict that P and N were
brother clades, in fact it looked to
me like P was closer to K. I
did not make predictions about the P, N, K structure because the statistics did
not justify such predictions. I
assigned samples to P and N with 80% probability, remarking that my overall confidence that P and N were valid (confidence at step zero) was 95% in 2008. I
stated my overall confidence in the subtypes of K type as only 80%, but again
my confidence in K type at step zero was (and still is) 95%.
P type has been validated as R1a1a7b, defined by the SNP L260.
N type is very close to the same as R1a1a7*, the paragroup defined by the SNP M458 minus L260. This is
not exactly a validation, because there are a low percent of M458 (2 samples so far at 67 markers) that seem to be older than N type, which implies
that a future SNP, younger than M458, may be discovered as equivalent to N
type. In previous versions
of this document, I explained: “A
new SNP marker may not fall at the node defining a type.” A new SNP might be younger, including
mostly the samples with low step from the corresponding type. A new SNP might be older, including
the corresponding type plus some samples with step beyond the cutoff for the type.
K type is not validated yet.
In Fall 2007 I also introduced R (Remainder) as the 4th division of Polish R1a, for those samples that do not fit P,
N, or K. K type plus the R
category are equivalent to R1a1a* (M17, M198, M458-). The R1a table assigns new types to
either K or R. In the detailed discussion of the types I discuss which types have: (a) high confidence as subtypes of K; (b)
high confidence as not subtypes of K so surely go into R; and (c) lower
confidence of assignment to K or R so are assigned with a best guess. A new SNP for K type might include a
few of these subtypes, and may include some of R, depending upon the age of
such a new SNP.
This topic uses R1a as an example, but
the same discussion applies to other haplogroup assignments.
My publications have several references of general interest and relevance to my web
documents.
My Tools and data
for STR analysis are Excel files. These are available at the JoGG
publication site as Supplementary Data: www.jogg.info/52/files/cpcindex.htm.
Polish
Clades Update. This
folder is for update of Tools and for new data: www.gwozdz.org/PolishCladesUpdate
Pawlowski (2002) Arch Med Sadowej Kryminol
52(4):261 (in Polish). This
reference is listed in my publications. I
specifically mention it here because this is where I originally found the
common Polish haplotype that I now call P type. Link to English abstract: Pawlowski 2002.
Lawrence Mayka is the Administrator of the Polish Project. Larry helped me to get started when I
was new to genetic genealogy, providing helpful criticism &
suggestions. He reviewed
& approved my 80% probability rule for assignments on the Polish Project
web page. He also reviewed
the original drafts of my publications. A
number of my types were originally suggested to me as STR clusters by Larry. Larry continues to provide data for
this web page. Many of my
references to other websites in this document were suggested to me by Larry.
Cyndi Rutledge is the administrator of the R1a Project. Larry and Cyndi send me M458 test results, which are not listed
on the web.
Anatole Klyosov published a pair of articles about STR
clusters in the same Fall issue of JoGG that has my pair of publications. Some of the STR types that I
independently discovered I later found as 25 marker modal haplotypes in
Klyosov’s web documents (before his publication
in JoGG - some in Russian). It
was encouraging to me seeing independent identification of clusters by
different methods. He emailed to me an English version of one of his 2008
publications. His Fall JoGG
articles have references to his other publications. Here is a web link: Klyosov Home.
Russian web sites: http://www.r1a.org; http://www.rodstvo.ru; http://dnatree.ru/; http://molgen.org/. These have been active analyzing R1a,
brought to my attention by others, particularly byMayka, who worked out a correlation with my types. These sites clearly have proposed
subdivisions of R1a based on STR data, but I cannot quickly understand these
due to the language barrier. Klyosovseems to be active at
these sites. The sites make
use of the FTDNA projects and Ysearch.
Kenneth Nordtvedt published an article about calculating TMRCA in the Fall 2008 issue of JoGG. His excel files of data and tools are
available at his web site. Ken has been active in web discussions,
suggesting many STR based clusters.
FTDNA link: www.familytreedna.com. This is a commercial DNA testing
company. I make extensive
use of the project databases maintained by FTDNA. These are my primary sources of
data. Click on the “Projects” tab at the home page to look for
projects. Also, the project
name can be substituted for /polish/ in the following URL.
Polish
Project link: www.familytreedna.com/public/polish. One of many FTDNA projects. This is my primary source for Polish
data. The Polish Project
tracks both Y-DNA and mtDNA; click
on “Y-DNA Results” on the left to see the data that I use.
R1a Project link: www.familytreedna.com/public/R1aY-Haplogroup. Another source.
Ysearch link: www.ysearch.org. Ysearch is the largest web database
for Y-DNA, run by FTDNA, open to all men, including men who also register with
projects and including men with data from other testing services. I use Ysearch often for analysis so of
course I encourage you to register your Y-DNA data at Ysearch. From the FTDNA site, you can register
your data with Ysearch. Or
you cantype your Y-STR data into Ysearch. I am not associated with the company
FTDNA. I have Instructions for comparing your STR data to my types (modal haplotypes) that I have entered into Ysearch.
Yhrd link: www.yhrd.org. A forensic Y-DNA data base. Data is separate by city, with many
Polish cities. I relied on
Yhrd to figure out the geography of the various haplotypes. I wrote a Yhrd Reminders for myself so that I won’t forget how to navigate the Yhrd web
site; click on that link if
you need some hints.
Sorenson link: http://www.smgf.org/. Another DNA testing company.
ISOGG link: http://isogg.org/tree/ Y-DNA tree with the most recent SNPs
and corresponding alphanumeric codes.
FTDNA
Draft Tree link: http://ytree.ftdna.com/index.php?name=Draft another Y-DNA tree with recent SNPs.
Peter Gwozdz
I’m a very rare type in Poland -
E1b1b1a2. My maternal 1st
cousins are R1a1a. That means my late maternal
grandfather was R1a1a. I
became interested in Y-DNA in 2004. My
maternal family name is Iwanowicz. I
discovered a family with that name in my maternal grandfather’s home town in
Poland. They are the only
Iwanowicz family within
Revision History
2007
Dec 6 First web posting of
this file
2007
Dec Two revisions
2008 8 revisions
2009
33 revisions
2010
Jan - Sep 27 revisions
2010
Oct 5 update of N type and subtypes of N
2010
Oct 14 update M417 & C type; new
Kz type
2010
Oct 18 new N1c1 (M178+) - G type
2010
Oct 25 R1a G type equivalent to L365; C
type M417-; Ne topic - R1a
New SNPs
2010
Nov 20 Update. Several
minor changes. Repair some
broken links
2010
Dec 5 Update Fa, Fb, and H types
2010
Dec20 Brief update of M458 & L260 results
2010
Dec 24 Finish update of the L260 and M458 results
2010
Dec 30 Rewrite L260 and M458 News. Also
new Ky type
2011
Jan 10 Complete rewrite of L260 M458 news, analysis, data
2011
Jan 13 update L365 G type; update
a few more L260 & M458
2011
Jan 17 new topic L260 and M458 Signatures
2011
Jan 29 N1c1 - M cluster
2011
May 14 Update
Haplogroup R1a (Y-DNA)
From
Wikipedia, the free encyclopedia
|
Haplogroup R1a
|
|
|
Possible time of origin |
probably more
recent than 18,500 years BP [1] |
|
Possible place of origin |
Asia,most
probably South Asia.
Other possibilities include Central Asia,Middle East, and Eastern Europe. |
|
Ancestor |
|
|
Descendants |
R1a1a1 to R1a1a8.
R-M458 being the most significant in Europe (R1a1a7 inUnderhill et al. (2009)). |
|
Defining mutations |
1. M420 now
defines R1a in the broadest sense.[2] |
|
Highest frequencies |
Parts of Eastern Europe, Scandinavia,Central Asia, Siberia and South Asia. (See List
of R1a frequency by population) |
.jpg)
Haplogroup R1a is the phylogenetic name of a major clade of human Y-chromosome lineages. In other words, it is a way of grouping a significant part of
all modern men according to a shared male-line ancestor. It is common in many parts of Eurasiaand is frequently discussed in human population genetics and genetic genealogy. One sub-clade (branch) of R1a, currently designated R1a1a, is much more
common than the others in all major geographical regions. R1a1a, defined by the SNPmutation M17, is particularly common in a large region extending from South Asia and Southern Siberia to Central Europe andScandinavia.[2]
Currently, the R1a family is defined
most broadly by the SNP mutation M420. The recent discovery of M420 resulted in a reorganization of the
known family tree of R1a, in particular establishing a new paragroup (designated R1a*) for the relatively rare lineages which are not in the
R1a1 branch leading to R1a1a.
R1a and R1a1a are believed to have
originated somewhere within Eurasia, most likely in the area from Eastern Europe to South Asia. The most
recent studies indicate that South Asia is the most likely region of origin.
Different meanings of "R1a"
Further
information: Conversion table for Y chromosome
haplogroups
The naming system commonly used for
R1a remains inconsistent in different published sources, and requires some
explanation.
In 2002, the Y chromosome consortium (YCC) proposed a new naming system for haplogroups, which has now become
standard.[3] In this system, names with the format "R1" and "R1a"
are "phylogenetic" names, aimed at marking positions in a family tree. Names of SNP mutations can also be used to name clades or haplogroups. For example,
as M173 is currently the defining mutation of R1, R1 is also R-M173, a "mutational" clade name. When a
new branching in a tree is discovered, some phylogenetic names will change, but
by definition all mutational names will remain the same.
The widely occurring haplogroup
defined by mutation M17 was known by various names, such as "Eu19",[4] in the older naming systems. The 2002 YCC proposal assigned the name R1a
to the haplogroup defined by mutation SRY1532.2. This included Eu19 (i.e.
R-M17) as a subclade, so Eu19 was named R1a1.[5] The discovery of M420 in 2009 has caused a reassignment of these
phylogenetic names.[2][6] R1a is now defined by the M420 mutation: in this updated tree, the
subclade defined by SRY1532.2 has moved from R1a to R1a1, and Eu19 (R-M17) from
R1a1 to R1a1a.
|
Contrasting
family trees for R1a |
|||||||||||||||||||||||||||||||||||||||||||||||||||||||||||||||||||||||||||||||||||||||||||||||||
|
2002 Scheme proposed in YCC (2002) |
2009 Scheme as
per Underhill et al. (2009) |
||||||||||||||||||||||||||||||||||||||||||||||||||||||||||||||||||||||||||||||||||||||||||||||||
|
|
||||||||||||||||||||||||||||||||||||||||||||||||||||||||||||||||||||||||||||||||||||||||||||||||
Phylogeny
The R1a family tree now has three major
levels of branching, with the largest number of defined subclades within the
dominant and best known branch, R1a1a (which, as has been noted, will be found
with various names; in particular, as "R1a1" in relatively recent but
not the latest literature.)
Roots of R1a
|
R1a, distinguished by several unique
markers including the M420 mutation, is a subclade of haplogroup R1, which is defined by SNP mutation M173. Besides R1a, R1 also has the subclades R1b,
defined by the M343 mutation, and the paragroup R1*. There is no simple
consensus concerning the places in Eurasia where R1, R1a or R1b evolved.
R1a (R-M420)
R1a, defined by the mutation M420,
has two branches: R1a1, defined by the mutation SRY1532.2, which makes up the
vast majority; and R1a*, the paragroup, defined as M420 positive but SRY1532.2 negative. (In the 2002 scheme,
this SRY1532.2 negative minority was one part of the relatively rare group
classified as the paragroup R1*.) Mutations understood to be equivalent to M420
include M449, M511, M513, L62, and L63.[2][6]
Only isolated samples of the new paragroup R1a* have been found by Underhill et al., mostly in the Middle East and Caucasus: 1/121 Omanis, 2/150 Iranians, 1/164 in the United Arab Emirates, and 3/612 in Turkey. Testing of 7224 more males in 73 other Eurasian populations showed no
sign of this category.[2]
R1a1 (R-SRY1532.2)
R1a1 is currently defined by SRY1532.2,
also referred to as SRY10831.2. SNP mutations understood to be always occurring
with SRY1532.2 include M448, M459, and M516.[2] This family of lineages is dominated by the very large and well-defined
R1a1a branch, which is positive for M17 and M198. The paragroup R1a1* (old R1a*) is positive for the SRY1532.2 marker but lacks either
the M17 or M198 markers.
The R1a1* paragroup is apparently
less rare than R1* but still relatively unusual, though it has been tested in
more than one survey. Underhill et al. for example report 1/51 in Norway, 3/305 in Sweden, 1/57 Greek Macedonians, 1/150 Iranians, 2/734 Ethnic Armenians, and 1/141 Kabardians.[2] While Sahoo et al. reported R1a*(new R1a1*) for 1/15 Himachal Pradesh
Rajput samples.[8]
R1a1a (R-M17 or R-M198)
R1a1a (old R1a1) makes up the vast
majority of all R1a over its entire geographic range. It is defined by SNP
mutations M17 or M198, which have always appeared together in the same men so
far. SNP mutations understood to be always occurring with M17 and M198 include
M417, M512, M514, M515.[2]
Currently, R1a1a has eight subclades
of its own defined by mutations, but the vast majority of the incidence has not
yet been categorized and is therefore in the paragroup R1a1a*.
R1a1a subclades

![]()
Frequency distribution of R1a1a7 (R-M458)
Currently, of the eight SNP-defined
subclades of R1a1a only R1a1a7 has significant frequencies. R1a1a7 is defined
by M458 and was found almost entirely in Europe, and with low frequency in
Turkey and parts of the Caucasus. Its highest frequencies were found in Central
and Southern Poland, particularly near the river valleys flowing northwards to the Baltic sea.[2]
R1a1a7 has its own SNP-defined
R1a1a7a subclade, defined by the M334 marker. However this mutation was found
only in one Estonian man and may define a very recently founded and small
clade.[2]
|
Relative frequency of R1a1a6 (R-M434) to R1a1a
(R-M17) |
||||||
|
Region |
People |
N |
R1a1a-M17 |
R1a1a6-M434 |
||
|
Number |
Freq. (%) |
Number |
Freq. (%) |
|||
|
Pakistan |
60 |
9 |
15% |
5 |
8% |
|
|
Pakistan |
60 |
15 |
25% |
4 |
7% |
|
|
Middle East |
121 |
11 |
9% |
3 |
2.5% |
|
|
Pakistan |
134 |
65 |
49% |
2 |
1% |
|
|
Table only shows positive
sets from N = 3667 derived from 60 Eurasian populations sample, Underhill et al. (2009) |
||||||
R1a1a3, defined by the M64.2, M87, and
M204 SNP mutations, is apparently rare: it was found in 1 of 117 males typed in
southern Iran.[9]
R1a1a6, defined by M434, was
detected in 14 people (out of 3667 people tested) all in a restricted
geographical range from Pakistan to Oman. This likely reflects a recent mutation event in Pakistan.[2]
R1a1a STR clusters
Genetic genealogists looking at high
accuracy STR (microsatellite) haplotypes (as used in genealogy) have also identified clusters of similar within R1a1a. Such clusters
equate to groups with probable common ancestry, but with no known SNP defining
them yet.
Gwozdz (2009) has identified two clusters within R1a1a7 ("P" and
"N"). Cluster P was originally identified by Pawlowski (2002) and
apparently accounts for about 8% of Polish men, making it the most common
clearly identifiable haplotype cluster in Poland. Outside of Poland it is less
common. Cluster N is not concentrated in Poland, but is apparently common in
many Slavic areas. Gwozdz also identified at least one large cluster of R1a1a*
(not having M458), referred to as cluster K. This cluster is common in Poland
but not only there.
Klyosov (2009) notes a potential clade identified by a mutation on the relatively
stable STR marker DYS388 (to an unusual repeat value of 10, instead of the more
common 12), noting that this "is observed in northern and western Europe,
mainly in England, Ireland, Norway, and to a much lesser degree in Sweden,
Denmark, Netherlands and Germany. In areas further east and south that mutation
is practically absent".
Both Gwozdz and Klyosov also note
frequent close STR matching between part of the Indian R1a1a population, and
part of the Russian and Slavic R1a1a population, indicating apparent links
between these populations in a time-frame more recent than the age of R1a1a
overall.
Distribution of R1a1a (R-M17 or R-M198)

![]()
Frequency distribution of R1a1a, also known as R-M17 and R-M198, adapted
from Underhill et al. (2009).
Further
information: List of R1a frequency by population
Further
information: Y-DNA haplogroups by ethnic groups
R1a has been found in high frequency
at both the eastern and western ends of its core range, for example in India and Tajikistanon the one hand, and Poland on the other. Throughout all of these regions, R1a is dominated by the
R1a1a (R-M17 or R-M198) sub-clade.
South Asia
In South Asia R1a1a has often been observed
with high frequency in a number of demographic groups.[8][10]
In India, high percentage of this haplogroup is observed in West Bengal Brahmins (72%) [10] to the east, Konkanastha Brahmins(48%) [10] to the west, Khatris (67%)[2] in north and Iyenger Brahmins (31%) [10] of south. It has also been found in severalSouth Indian Dravidian-speaking Adivasis including the Chenchu (26%) and the Valmikis of Andhra Pradesh and the Kallar ofTamil Nadu suggesting that M17 is widespread in Tribal Southern Indians.[11]
Besides these, studies show high
percentages in regionally diverse groups such as Manipuris (50%)[2] to the extreme North East and in Punjab (47%)[11] to the extreme North West.
In Pakistan it is found at 71% among the Mohanna of Sindh Province to the south and 46% among the Baltis of Gilgit-Baltistan to the north.[2] While 13% of Sinhalese of Sri Lanka were found to be R1a1a (R-M17) positive.[11]
Hindus of Terai region of Nepal show it at 69%.[12]
Europe
In Europe, R1a, again almost
entirely in the R1a1a sub-clade, is found at highest levels among peoples of
Eastern European descent (Sorbs, Poles, Russians and Ukrainians; 50 to 65%).[13][14][15] In the Baltic countries R1a frequencies decrease from Lithuania (45%) to
Estonia (around 30%).[16] Levels in Hungarians have been noted between 20 and 60% [15] found a level of 60% but a later study,[17] found haplogroup R1a Y-DNA in only 20.4% of a sample of 113 Hungarians. Rosser et al. (2000) found SRY1532b positive lineages in approximately 22% (8/36) of a
Hungarian sample. Battaglia et al. (2008) found haplogroup R1a1a-M17 in approximately 57% of a sample of 53
Hungarians.
There is a significant presence in
peoples of Scandinavian descent, with highest levels in Norway and Iceland, where between 20 and 30% of men are in R1a1a.[18][19] Vikings andNormans may have also carried the R1a1a lineage westward; accounting for at
least part of the small presence in the British Isles.[20][21][22][23]
Haplogroup R1a1a was found at
elevated levels amongst a sample of the Israeli population who self-designated
themselves as Ashkenazi Jews, originally from European Jewish communities,
compared with Sephardic and Middle Eastern Jews. The authors stated that the
reasons for these chromosomes in the population is unknown, but could possibly
reflect gene flow into Ashkenazi populations from surrounding Eastern European
populations, over a course of centuries. This haplogroup finding was apparently
consistent with the latest SNPmicroarray analysis which argued that up to 55 percent of the modern Ashkenazi
genome is specifically traceable to Europe.[24][25]
Ashkenazim were found to have a
significantly higher frequency of the R-M17 haplogroup Behar reported R-M17 to
be the dominant haplogroup in Ashkenazi Levites (52%), although rare in
Ashkenazi Cohanim (1.3%) and Israelites (4%).[14]
In Southern Europe R1a1a is not common
amongst the general population, but it is widespread in certain areas.
Significant levels have been found in pockets, such as in the Pas Valleyin Northern Spain, areas of Venice, and Calabria in Italy.[26] The Balkans shows lower frequencies, and significant variation between areas, for
example >30% in Slovenia, Croatia andGreek Macedonia, but <10% in Albania, Kosovo and parts of Greece.[15][27][28]
The remains of three individuals,
from an archaeological site discovered in 2005 near Eulau (in Saxony-Anhalt, Germany) and dated to about 2600 BCE, tested positive for the Y-SNP marker
SRY10831.2.[29] The R1a1 clade was thus present in Europe at least 4600 years ago, and
appears associated with the Corded Ware culture.[30]
Central and Northern Asia
R1a1a frequencies vary widely between
populations within central and northern parts of Eurasia, but it is found in
areas including Western China and Eastern Siberia. This variation is possibly a consequence of population bottlenecks in isolated areas and the movements of Scythians in ancient times and later the Turco-Mongols. High frequencies of R1a1a (R-M17 or R-M198; 50 to 70%) are found among
the Ishkashimis, Khojant Tajiks, Kyrgyzs, and in several peoples of Russia's Altai Republic.[17][31][32] Although levels are comparatively low amongst some Turkic-speaking groups (e.g. Turks, Azeris, Kazakhs, Yakuts), levels are very high in certain Turkic or Mongolic-speaking groups of Northwestern China, such as theBonan, Dongxiang, Salar, and Uyghurs.[31][33][34] R1a1a is also found among certain indigenous Eastern Siberians, including:Kamchatkans and Chukotkans,
and peaking in Itel'man at 22%.[35]
Middle East and Caucasus
R1a1a has been found in various
forms, in most parts of Western Asia, in widely varying concentrations, from almost no presence in areas
such as Jordan, to much higher levels in parts of Kuwait, Turkey and Iran.[36][37][38]
The Shimar (Shammar) Bedouin tribe in Kuwait show the highest frequency in the Middle East at 43%.[36]
Wells et al. (2001), noted that in the western part of the country, Iranians show low
R1a1a levels, while males of eastern parts of Iran carried up to 35% R1a. Nasidze et al. (2004) found R1a in approximately 20% of Iranian males from the cities of Tehran and Isfahan. Regueiro et al. (2006), in a study of Iran, noted much higher frequencies in the south than the north.
Turkey also shows high but unevenly
distributed R1a levels amongst some sub-populations. For example Nasidze et al. (2005) found relatively high levels amongst Kurds (12%) andZazas (26%).
Further to the north of these Middle
Eastern regions on the other hand, R1a levels start to increase in the Caucasus, once again in an uneven way. Several populations studied have shown no
sign of R1a, while highest levels so far discovered in the region appears to
belong to speakers of the Karachay-Balkar language amongst whom about one quarter of men tested so far are in haplogroup
R1a1a.[2]
Origins
and hypothesized migrations of R1a1a
Most discussions purportedly of R1a
origins are actually about the origins of the dominant R1a1a (R-M17 or R-M198)
sub-clade. Data so far collected indicates that there two widely separated
areas of high frequency, one in South Asia, around Indo-Gangetic Plain, and the other
in Eastern Europe, around Poland and Ukraine. The historical and prehistoric possible reasons for this are the
subject of on-going discussion and attention amongst population geneticists and
genetic genealogists, and are considered to be of potential interest to
linguists and archaeologists also.
In 2009, several large studies of
both old and new STR data[39] concluded that while these two separate "poles of the
expansion" are of similar age, South Asian R1a1a is apparently older than
Eastern European R1a1a, suggesting that South Asia is the more likely locus of
origin.[40]
South Asian origin hypothesis
An increasing number of studies have
found South Asia to have the highest level of diversity of Y-STR haplotype variation within R1a1a. On this basis, while several studies
have concluded that the data is consistent with South Asia as the likely
original point of dispersal (for example, Kivisild et al. (2003), Mirabal et al. (2009) and Underhill et al. (2009)) a few have actively argued for this scenario (for example Sengupta et al. (2005), Sahoo et al. (2006), Sharma et al. (2009). A survey study as of December 2009, including a collation of retested
Y-DNA from previous studies, makes a South Asian R1a1a origin the strongest
proposal amongst the various possibilities.[2]
Central
Asia
Cordaux et al. (2004) argued, citing data from 3 earlier publications, that R-M17 (R1a1a) Y
chromosomes most probably have a central Asian origin.[41] Central Asia is still considered a possible place of origin by Mirabal et al. (2009) after their larger analysis of more recent data. However these authors
also consider other parts of Asia, particularly South Asia, to likely places of
origin.
Middle East
As mentioned above, R1a haplotypes
are less common in most of the Middle East than they are in either South Asia or Eastern Europe or much of Central
Asia. It has nevertheless been mentioned in speculation about the origins of
the clade. This is both because there are above-described pockets of high
frequency and diversity, for example in some parts of Iran and amongst some
Kurdish populations. A Middle Eastern origin for R1a has long been considered a
possibility, and is still considered to be consistent with known data.[2][9][11][15]
Eastern European migration hypotheses
|
Coalescent time estimates for
R1a1a(xM458) STR from Underhill et al. (2009) |
|
|
Location |
TD |
|
W. India |
15,800 |
|
Pakistan |
15,000 |
|
Nepal |
14,200 |
|
India |
14,000 |
|
Oman |
12,500 |
|
N. India |
12,400 |
|
S. India |
12,400 |
|
Caucasus |
12,200 |
|
E. India |
11,800 |
|
Poland |
11,300 |
|
Slovakia |
11,200 |
|
Crete |
11,200 |
|
Germany |
9,900 |
|
Denmark |
9,700 |
|
UAE |
9,700 |
A widely cited theory proposed in
2000 that there may have been two expansions: first, R1a1a originally spreading
from a Ukrainian refugium during theLate Glacial Maximum; and then, the
spread being magnified by the expansion of males from the Kurgan culture.[15] A recent survey argues that R1a1a could be old enough for this scenario,
but find it more likely that it was initially in Asia even if it was in parts
of Europe by approximately 11,000 years ago.[2]
Most age estimates for R1a1a having
such an early presence in Europe come from papers using the
"evolutionarily effective" methodology described by
[[#CITEREFZhivotovskyUnderhillCinnio�luKayser2004|Zhivotovsky
et al. (2004]]), the latest such example being Mirabal et al. (2009) and Underhill et al. (2009). Researchers using this dating method therefore conclude that any
Neolithic or more recent dispersals of R1a1a do not represent the initial
spread of the whole clade, and might be more visible in the distribution of a
subclade or subclades. Underhill et al. (2009) remark on the "geographic concordance of the R1a1a7-M458
distribution with the Chalcolithic and Early Bronze Age Corded Ware (CW) cultures of Europe". However they also note evidence contrary
to a connection: Corded Ware period human remains at Eulau from which Y-DNA was extracted of R1a haplogroup appear to be
R1a1a*(xM458) (which they found most similar to the modern German R1a1a*
haplotype.)
In papers where the Zhivitovsky
method is not the only method used, Europe's R1a1a diversity is generally
understood to have been shaped more significantly by more recent events,
including not only the Bronze Age, but also the spread of Slavic languages. Dupuy et al. (2005) speculated that "R1a [in Norway] might represent the spread of
the Corded Ware and Battle-Axe cultures from central and east Europe." Luca et al. (2006), looking at data from the Czech Republic suggested there was evidence
for a rapid demographic expansion approximately 1500 years ago.
[[#CITEREFRebalaMikulichTsybovskySiv�kov2007|Rebala
et al. (2007]]) also detected Y-STR evidence of a recent Slavic expansion from
the area of modern Ukraine. Gwodzdz (2009) saw evidence for a "rapid population expansion somewhat less than
1,500 years ago in the area that is now Poland".
Steppe
cultures
Archaeologists recognize a complex of inter-related and relatively mobile cultures living on the Eurasian steppe, part of which protrudes into Europe as far west as Ukraine. These cultures from the late Neolithic and into the Iron Age, with specific traits such as Kurgan burials and horse domestication, have been
associated with the dispersal of Indo-European languages across Eurasia. Nearly all samples from Bronze and Iron Age graves in
the Krasnoyarsk area in south Siberia belonged to R1a1-M17 and appeared to represent an
eastward migration from Europe.[42]
Geneticists believing that they see
evidence of R1a1a gene-flow from the Eurasian Steppe to India have frequently
proposed the involvement of these Steppe cultures in the process.[43]Such a Steppe origin for all or part R1a1a continues to be argued on the
basis of DNA results from ancient remains from several South Siberian late Kurgan
sites, including some from the Andronovo culture.[44] However, in recent discussions of this theory it is considered only to
apply to a part of R1a1a, making this theory no longer incompatible with other
origins theories for R1a more broadly defined.[2][45]
Popular
science
Bryan Sykes in his book Blood of the Isles gives imaginative names to the
founders or "clan patriarchs" of major British Y haplogroups, much as
he did for mitochondrial haplogroups in his work The Seven Daughters of Eve. He named R1a1a in Europe the "clan" of a
"patriarch" Sigurd, reflecting the theory that R1a1a in the British
Isles has Norse origins. It should be noted that this does not mean that there ever was
any clan or other large grouping of people, which was dominated by R1a1a or any
other major haplogroup. Real clans and ethnic groups are made up of men in many
Y Haplogroups.
See also
§
List of R1a frequency by population
§
Human
Y-chromosome DNA haplogroups
§
Genetics and Archaeogenetics of
South Asia
§
Y-DNA haplogroups by ethnic groups
§
Somerled
|
Evolutionary tree of Human Y-chromosome DNA (Y-DNA) haplogroups |
|||||||||||||||||||||||||
|
|
|||||||||||||||||||||||||
|
|
|
|
|||||||||||||||||||||||
|
|
|
|
|||||||||||||||||||||||
|
|
|
|
|||||||||||||||||||||||
|
|
|
|
|
||||||||||||||||||||||
|
|
|
|
|
||||||||||||||||||||||
|
|
|
|
|
||||||||||||||||||||||
|
|
|
|
|
|
|||||||||||||||||||||
|
|
|
|
|
||||||||||||||||||||||
|
|
|
|
|||||||||||||||||||||||
|
|
|
||||||||||||||||||||||||
|
|
R1a |
|
|
||||||||||||||||||||||
|
|
|||||||||||||||||||||||||
|
|
|
|
|
|
|
|
|
|
|
|
|
|
|
|
|
|
|
|
|
|
|
|
|
|
|
Notes
1.
^ Karafet et al. (2008). See Table 2, giving age of parent clade R1.
2.
^ a b c d e f g h i j k l m n o p q r s Underhill et al. (2009)
4.
^ as used in Semino et al. (2000)
5.
^ SRY1532.2 is also known as SRY10831.2
6.
^ a b ISOGG
phylogenetic tree
7.
^ Also identifiable with the standardized SNP reference rs34351054.
8.
^ a b Sahoo et al. (2006)
9.
^ a b Regueiro et al. (2006)
10.
^ a b c d Sengupta et al. (2005)
11.
^ a b c d Kivisild et al. (2003)
12.
^ Fornarino et al. (2009)
13.
^ Balanovsky et al. (2008)
14.
^ a b Behar et al. (2003)
15.
^ a b c d e Semino et al. (2000)
16.
^ Kasperaviciūte, Kucinskas & Stoneking (2005)
17.
^ a b Tambets et al. (2004)
18.
^ Bowden et al. (2008)
19.
^ Dupuy et al. (2005)
20.
^ Irish Heritage DNA Project, R1 and R1a
21.
^ Passarino et al. (2002)
22.
^ Capelli et al. (2003)
23. ^ Garvey, D. "Y Haplogroup R1a1". Archived from the original on February 8, 2007. Retrieved 2007-04-23.
24.
^ Braya, Mullea & Dodda (2010)
25.
^ Nebel et al. (2001)
26.
^ Scozzari et al. (2001)
27.
^ Rosser et al. (2000)
28.
^ Pericić et al. (2005)
29.
^ The Ysearch number for the Eulau remains is 2C46S.
30.
^ Haak et al. (2008)
31.
^ a b Wells et al. (2001)
32.
^ Kharkov et al. (2007)
33.
^ Wang et al. (2003)
34.
^ Zhou et al. (2007)
35.
^ Lell et al. (2002)
36.
^ a bhttp://www.ncbi.nlm.nih.gov/pmc/articles/PMC2869035/table/T3/
37.
^ Nasidze et al. (2004)
38.
^ Nasidze et al. (2005)
39.
^ See Mirabal et al. (2009) and Underhill et al. (2009)
40.
^ Mirabal et al. (2009) additionally felt the data to be consistent with central Asian, while Underhill et al. (2009) took to the data to be consistent with Western Asian origins.
41.
^ Wells et al. (2001), Semino et al. (2000), and Quintana-Murci et al. (2001)
42.
^ Keyser et al. (2009)
43.
^ For several examples from 2002, see Semino et al. (2000), Passarino et al. (2001), Passarino et al. (2002) and Wells (2002)
44.
^ See Keyser et al. (2009): 9 out of 10 male specimens were found to be in R1a1a, evidence felt
by the authors to suggest that the Steppes Kurgan culture spread from Europe to
Siberia.
45.
^ Kloyosov (2009)
References
§
Adams, Susan M.; Bosch, E; Balaresque, PL;
Ballereau, SJ; Lee, AC; Arroyo, E; L�pez-Parra,
AM; Aler, M et al. (2008), "The Genetic Legacy of Religious Diversity and Intolerance:
Paternal Lineages of Christians, Jews, and Muslims in the Iberian
Peninsula", The American Journal of Human Genetics 83 (6): 725, doi:10.1016/j.ajhg.2008.11.007, PMC 2668061,PMID 19061982
§
Al Zahery, N.; Semino, O.; Benuzzi, G.; Magri, C.; Passarino, G.; Torroni,
A.; Santachiara-Benerecetti, A.S. (doi=10.1016/S1055-7903(03)00039-3), "Y-chromosome and mtDNA polymorphisms in Iraq, a crossroad of the
early human dispersal and of post-Neolithic migrations", Molecular Phylogenetics and Evolution 28 (3): 458–72, doi:10.1016/S1055-7903(03)00039-3,PMID 12927131
§
Balanovsky, O; Rootsi, S; Pshenichnov, A; Kivisild, T; Churnosov, M;
Evseeva, I; Pocheshkhova, E; Boldyreva, M et al. (2008), "Two Sources of the Russian Patrilineal Heritage in Their Eurasian
Context", AJHG 82 (1): 236–250, doi:10.1016/j.ajhg.2007.09.019, PMC 2253976, PMID 18179905
§
Bamshad, M.; Kivisild, T; Watkins, WS; Dixon, ME; Ricker, CE; Rao, BB; Naidu,
JM; Prasad, BV et al. (2001), "Genetic
evidence on the origins of Indian caste populations", Genome Research11 (6): 994–1004, doi:10.1101/gr.GR-1733RR, PMC 311057, PMID 11381027.
§ Barać, Lovorka; Pericić, Marijana; Klarić, Irena Martinović; Rootsi, Siiri; Janićijević, Branka; Kivisild, Toomas; Parik, Jüri; Rudan, Igor et al. (July 2003), "Y chromosomal heritage of Croatian population and its island isolates", Eur. J. Hum. Genet. 11 (7): 535–42, doi:10.1038/sj.ejhg.5200992, PMID 12825075.
§
Battaglia, Vincenza; Fornarino, S; Al-Zahery, N; Olivieri, A;
Pala, M; Myres, NM; King, RJ; Rootsi, S et al. (2008), "Y-chromosomal evidence of the cultural diffusion of agriculture in
southeast Europe", European Journal of Human Genetics 17 (6): 820–30, doi:10.1038/ejhg.2008.249, PMC 2947100, PMID 19107149
§
Behar, D; Thomas, MG; Skorecki, K; Hammer, MF; Bulygina, E; Rosengarten, D;
Jones, AL; Held, K et al. (2003), "Multiple Origins of Ashkenazi Levites: Y Chromosome Evidence for
Both Near Eastern and European Ancestries" (– Scholar search), Am. J. Hum. Genet. 73 (4): 768–779, doi:10.1086/378506, PMC 1180600, PMID 13680527[dead link]. Also athttp://www.ucl.ac.uk/tcga/tcgapdf/Behar-AJHG-03.pdf and http://www.familytreedna.com/pdf/400971.pdf
§
Bouakaze, C.; Keyser, C; Amory, S; Crub�zy, E; Ludes, B (2007), "First
successful assay of Y-SNP typing by SNaPshot minisequencing on ancient
DNA", International Journal of Legal Medicine121 (6): 493–9, doi:10.1007/s00414-007-0177-3, PMID 17534642
§
Bowden, G. R.; Balaresque, P; King, TE; Hansen, Z; Lee, AC; Pergl-Wilson, G;
Hurley, E; Roberts, SJ et al. (2008), "Excavating Past Population Structures by Surname-Based Sampling:
The Genetic Legacy of the Vikings in Northwest England", Molecular Biology and Evolution 25 (2): 301–309, doi:10.1093/molbev/msm255, PMC 2628767, PMID 18032405
§
Braya, Steven; Mullea, Jennifer; Dodda, Anne; Pulver, Ann; Wooding, Stephen;
Warren, Stephen (2010), "Signatures of founder effects, admixture, and selection in the
Ashkenazi Jewish population", PNAS 107 (37): 16222–16227, doi:10.1073/pnas.1004381107, PMC 2941333, PMID 20798349
§
Capelli, C; Redhead, N;
Abernethy, JK; Gratrix, F; Wilson, JF; Moen, T; Hervig, T; Richards, M
et al. (2003), "A Y Chromosome Census of the British Isles", Current Biology 13 (11): 979–84,doi:10.1016/S0960-9822(03)00373-7, PMID 12781138 also at "University College London".</ref>
§
Cinnioğlu, C; King, R; Kivisild, T; Kalfo�lu, E; Atasoy, S; Cavalleri, GL; Lillie,
AS; Roseman, CC et al. (2004), "Excavating Y-chromosome haplotype strata in Anatolia", Hum Genet 114 (2): 127, doi:10.1007/s00439-003-1031-4, PMID 14586639
§
Cordaux, Richard; Aunger, R; Bentley, G; Nasidze, I; Sirajuddin, SM; Stoneking,
M (2004), "Independent Origins of Indian Caste and Tribal Paternal
Lineages", Current
Biology 14 (3): 231–235,doi:10.1016/j.cub.2004.01.024, PMID 14761656
§
Dupuy, Berit Myhre; Stenersen, M; Lu, TT; Olaisen, B (2005), "Geographical heterogeneity of Y-chromosomal lineages in
Norway", Forensic Science International 164 (1): 10–19,doi:10.1016/j.forsciint.2005.11.009, PMID 16337760
§
Firasat, Sadaf; Khaliq, S; Mohyuddin, A; Papaioannou, M; Tyler-Smith, C;
Underhill, PA; Ayub, Q (2006), "Y-chromosomal evidence for a limited Greek contribution to the
Pathan population of Pakistan", European Journal of Human Genetics 15 (1): 121–126, doi:10.1038/sj.ejhg.5201726, PMC 2588664, PMID 17047675
§
Flores, Carlos; Maca-Meyer, N; Larruga, JM; Cabrera, VM; Karadsheh, N;
Gonzalez, AM (2005), "Isolates in a corridor of migrations: a
high-resolution analysis of Y-chromosome variation in Jordan", J Hum Genet 50 (9): 435–441, doi:10.1007/s10038-005-0274-4, PMID 16142507
§
Fornarino, Simona; Pala, Maria; Battaglia, Vincenza; Maranta, Ramona; Achilli,
Alessandro; Modiano, Guido; Torroni, Antonio; Semino, Ornella et al. (2009), "Mitochondrial and Y-chromosome diversity of the Tharus (Nepal): a
reservoir of genetic variation", BMC Evolutionary Biology 9: 154, doi:10.1186/1471-2148-9-154, PMC 2720951, PMID 19573232
§
Gimbutas (1970), Indo-European and Indo-Europeans, Univ. of Pennsylvania Press,
Philadelphia, PA, pp. 155–195
§
Gwozdz (2009), "Y-STR Mountains in Haplospace, Part II: Application to Common
Polish Clades", Journal of Genetic Genealogy 5 (2)
§
Haak, W.; Brandt, G.; Jong, H. N. d.; Meyer, C.; Ganslmeier, R.; Heyd, V.;
Hawkesworth, C.; Pike, A. W. G. et al. (2008), "Ancient DNA, Strontium isotopes, and osteological analyses shed
light on social and kinship organization of the Later Stone Age", Proceedings of the National Academy of
Sciences 105 (47pages=18226–18231): 18226, doi:10.1073/pnas.0807592105,PMC 2587582, PMID 19015520
§ Hammer, Michael F.; Behar, Doron M.; Karafet, Tatiana M.; Mendez, Fernando L.; Hallmark, Brian; Erez, Tamar; Zhivotovsky, Lev A.; Rosset, Saharon et al. (2009), "Response", Human Genetics 126 (5): 725–726, doi:10.1007/s00439-009-0747-1
§
Helgason, A; Sigureardottir, S; Nicholson, J; Sykes, B; Hill, E;
Bradley, D; Bosnes, V; Gulcher, J et al. (2000), "Estimating Scandinavian
and Gaelic Ancestry in the Male Settlers of Iceland", Am Journal of Human Genetics 67 (3): 697, doi:10.1086/303046
§
Karafet, TM; Mendez, FL; Meilerman, MB; Underhill, PA; Zegura, SL; Hammer, MF
(May 2008), Abstract "New Binary Polymorphisms Reshape and Increase Resolution of
the Human Y-Chromosomal Haplogroup Tree", Genome Research 18 (5): 830, doi:10.1101/gr.7172008, PMC 2336805, PMID 18385274. Published online April 2, 2008. See also Supplementary
Material.
§
Kasperaviciūte, D.; Kucinskas, V.; Stoneking, M. (2005), "Y Chromosome and Mitochondrial DNA Variation in Lithuanians", Annals of Human Genetics 68 (5): 438–452, doi:10.1046/j.1529-8817.2003.00119.x
§
Kayser, M; Lao, O; Anslinger, K; Augustin, C; Bargel, G; Edelmann, J; Elias, S;
Heinrich, M et al. (2005), "Significant
genetic differentiation between Poland and Germany follows present-day
political borders, as revealed by Y-chromosome analysis", Human Genetics 117 (5): 428–443, doi:10.1007/s00439-005-1333-9, PMID 15959808 A copy can be found here [1].
§
Keyser et al (2009), Ancient DNA provides new insights into the history of south Siberian
Kurgan people
§
Kharkov, V. N.; Stepanov, V. A.; Borinskaya, S. A.; Kozhekbaeva, Zh.
M.; Gusar, V. A.; Grechanina, E. Ya.; Puzyrev, V. P.; Khusnutdinova, E. K. et
al. (2004), "Gene Pool Structure of Eastern Ukrainians as Inferred from the
Y-Chromosome Haplogroups", Russian Journal of Genetics 40 (3): 326, doi:10.1023/B:RUGE.0000021635.80528.2f A
copy can be found here [2].
§
Kharkov, V. N.; Stepanov, V. A.; Feshchenko, S. P.; Borinskaya, S. A.;
Yankovsky, N. K.; Puzyrev, V. P. (2005), "Frequencies of Y Chromosome Binary Haplogroups in
Belarussians", Russian Journal of Genetics 41 (8): 928–931, doi:10.1007/s11177-005-0182-x A
copy can be found here [3].
§
Kharkov, V. N.; Stepanov, V. A.; Medvedeva, O. F.; Spiridonova, M. G.;
Voevoda, M. I.; Tadinova, V. N.; Puzyrev, V. P. (2007), "Gene Pool Differences between Northern and Southern Altaians
Inferred from the Data on Y-Chromosomal Haplogroups", Russian Journal of Genetics 43 (5): 551, doi:10.1134/S1022795407050110
§
King, RJ; Ozcan, SS; Carter, T; Kalfo�lu, E; Atasoy, S; Triantaphyllidis, C;
Kouvatsi, A; Lin, AA et al. (2008), "Differential Y-chromosome Anatolian Influences on the Greek and
Cretan Neolithic", Annals of Human Genetics 72 (Pt 2): 205–214, doi:10.1111/j.1469-1809.2007.00414.x, PMID 18269686
§
Kivisild, T; Rootsi, S; Metspalu, M; Mastana, S; Kaldma, K; Parik, J; Metspalu,
E; Adojaan, M et al. (2003), "The Genetic Heritage of the Earliest Settlers Persists Both in
Indian Tribal and Caste Populations", AJHG 72 (2): 313, doi:10.1086/346068, PMC 379225, PMID 12536373.
§
Klyosov (October 2009a), "A comment on the paper: Extended Y chromosome haplotypes resolve
multiple and unique lineages of the Jewish Priesthood by M.F. Hammer, D.M.
Behar, T.M. Karafet, F.L. Mendez, B. Hallmark, T. Erez, L.A. Zhivotovsky, S.
Rosset, K. Skorecki", Human Genetics 126 (5): 719, doi:10.1007/s00439-009-0739-1, PMID 19813025
§
Klyosov (2009), "DNA Genealogy, Mutation Rates, and Some Historical Evidence
Written in Y-Chromosome, Part II: Walking the Map", Journal of Genetic Genealogy 5 (2)
§
Lalueza-Fox, C.; Robello, M; Mao, C; Mainardi, P; Besio, G; Pettener, D.;
Bertranpetit, J. (2004), "Unravelling migrations in the steppe: mitochondrial DNA sequences
from ancient central Asians.", Proc Biol Sci. 271 (1542): 941–947, doi:10.1098/rspb.2004.2698, PMC 1691686, PMID 15255049
§ Lell, JT; Sukernik, RI; Starikovskaya, YB; Su, B; Jin, L; Schurr, TG; Underhill, PA; Wallace, DC (2002), "The Dual Origin and Siberian Affinities of Native American Y Chromosomes", Am. J. Hum. Genet. 70 (1): 192–206, doi:10.1086/338457, PMC 384887, PMID 11731934
§
Luca, F; Di Giacomo, F; Benincasa, T; Popa, LO; Banyko, J; Kracmarova, A;
Malaspina, P; Novelletto, A et al. (2006), "Y-Chromosomal Variation in the Czech Republic", American Journal of Physical Anthropology 132 (1): 132, doi:10.1002/ajpa.20500, PMID 17078035
§
Malaspina (2003), Analysis of Y-chromosome variation in modern populations at the
European-Asian border, pp. 309–313 in K. Boyle, C. Renfrew,
and M. Levine, eds. Ancient interactions: east and west in Eurasia. McDonald
Institute for Archaeological Research Monograph Series, Cambridge University
Press, Cambridge
§ Marjanovic, D; Fornarino, S; Montagna, S; Primorac, D.; Hadziselimovic, R.; Vidovic, S.; Pojskic, N.; Battaglia, V. et al. (November 2005), "The peopling of modern Bosnia-Herzegovina: Y-chromosome haplogroups in the three main ethnic groups", Ann. Hum. Genet. 69 (Pt 6): 757–63, doi:10.1111/j.1529-8817.2005.00190.x, PMID 16266413.
§ Mirabal, Sheyla; Regueiro, M; Cadenas, AM; Cavalli-Sforza, LL; Underhill, PA; Verbenko, DA; Limborska, SA; Herrera, RJ (2009), "Y-Chromosome distribution within the geo-linguistic landscape of northwestern Russia", European Journal of Human Genetics 17 (10): 1260–1273, doi:10.1038/ejhg.2009.6, PMC 2986641, PMID 19259129
§
Mukherjee, Namita; Nebel, Almut; Oppenheim, Ariella; Majumder, Partha P. (2001),
"High-resolution analysis of Y-chromosomal polymorphisms reveals
signatures of population movements from central Asia and West Asia into
India", Journal of Genetics 80 (3): 125–135, December, 2001, doi:10.1007/BF02717908.
§
Nasidze, I; Ling, EY; Quinque, D; Dupanloup, I; Cordaux, R; Rychkov, S; Naumova,
O; Zhukova, O et al. (2004), "Mitochondrial DNA and Y-Chromosome Variation in the Caucasus", Annals of Human Genetics 68 (Pt 3): 205–221, doi:10.1046/j.1529-8817.2004.00092.x, PMID 15180701
§
Nasidze, Ivan; Quinque, D; Ozturk, M; Bendukidze, N; Stoneking, M (2005), "MtDNA and Y-chromosome Variation in Kurdish Groups", Annals of Human Genetics 69 (Pt 4): 401–412,doi:10.1046/j.1529-8817.2005.00174.x, PMID 15996169
§
Nebel, Almut; Filon, Dvora; Brinkmann, Bernd; Majumder, Partha; Faerman,
Marina; Oppenheim, Ariella last6=Oppenheim (2001), "The Y Chromosome Pool of Jews as Part of the Genetic Landscape of
the Middle East", The American Journal of Human Genetics 69 (5): 1095–112, doi:10.1086/324070, PMC 1274378, PMID 11573163
§ Passarino, G; Semino; Magria; Al-Zahery (2001), "The 49a,f haplotype 11 is a new marker of the EU19 lineage that traces migrations from northern regions of the black sea", Hum. Immunol. 62(9): 922–932, doi:10.1016/S0198-8859(01)00291-9.
§ Passarino, Giuseppe; Cavalleri, GL; Lin, AA; Cavalli-Sforza, LL; B�rresen-Dale, AL; Underhill, PA (2002), "Different genetic components in the Norwegian population revealed by the analysis of mtDNA and Y chromosome polymorphisms", Eur. J. Hum. Genet. 10 (9): 521–9, doi:10.1038/sj.ejhg.5200834, PMID 12173029.
§ Pawlowski, R; Dettlaff-Kakol, A; MacIejewska, A; Paszkowska, R; Reichert, M; Jezierski, G (2002), "Population genetics of 9 Y-chromosome STR loci w Northern Poland", Arch. Med. Sadowej Kryminol 52 (4): 261–277, PMID 14669672
§ Pericić, M.; Lauc, LB; Klari�, IM; Rootsi, S; Jani�ijevic, B; Rudan, I; Terzi�, R; Colak, I et al. (2005), "High-resolution phylogenetic analysis of southeastern Europe traces major episodes of paternal gene flow among Slavic populations", Mol. Biol. Evol. 22 (10): 1964–75, doi:10.1093/molbev/msi185, PMID 15944443.
§
Qamar, R; Ayub, Q;
Mohyuddin, A; Helgason, A; Mazhar, K; Mansoor, A; Zerjal, T;
Tylersmith, C et al. (2002),
"Y-Chromosomal DNA Variation in Pakistan", The American Journal of Human Genetics 70 (5): 1107, doi:10.1086/339929, PMC 447589, PMID 11898125
§ Quintana-Murci, L; Krausz, C; Zerjal, T; Sayar, SH; Hammer, MF; Mehdi, SQ; Ayub, Q; Qamar, R et al. (2001), "Y-chromosome lineages trace diffusion of people and languages in southwestern Asia", Am. J. Hum. Genet 68 (2): 537–542, doi:10.1086/318200, PMC 1235289, PMID 11133362
§ Rebala, Krzysztof; Mikulich, AI; Tsybovsky, IS; Siv�kov�, D; Dzupinkov�, Z; Szczerkowska-Dobosz, A; Szczerkowska, Z (2007), "Y-STR variation among Slavs: evidence for the Slavic homeland in the middle Dnieper basin", Journal of Human Genetics 52 (5): 406–414, doi:10.1007/s10038-007-0125-6, PMID 17364156
§
Regueiro, M; Cadenas, AM; Gayden, T; Underhill, PA; Herrera, RJ (2006), "Iran: Tricontinental Nexus for Y-Chromosome Driven Migration", Hum Hered 61 (3): 132–143,doi:10.1159/000093774, PMID 16770078
§
Rosser, ZH; Zerjal, T; Hurles, ME; Adojaan, M; Alavantic, D; Amorim, A; Amos,
W; Armenteros, M et al. (2000), "Y-Chromosomal Diversity in Europe Is Clinal and Influenced
Primarily by Geography, Rather than by Language", American Journal of Human Genetics 67 (6): 1526–1543., doi:10.1086/316890, PMC 1287948, PMID 11078479
§ Saha, Anjana; Sharma, S; Bhat, A; Pandit, A; Bamezai, R (2005), "Genetic affinity among five different population groups in India reflecting a Y-chromosome gene flow", J. Hum. Genet. 50 (1): 49–51, doi:10.1007/s10038-004-0219-3, PMID 15611834.
§
Sahoo, S; Singh, A; Himabindu, G; Banerjee, J; Sitalaximi, T; Gaikwad, S;
Trivedi, R; Endicott, P et al. (2006), "A prehistory of Indian Y chromosomes: Evaluating demic diffusion
scenarios",Proceedings
of the National Academy of Sciences 103 (4): 843–848, doi:10.1073/pnas.0507714103, PMC 1347984, PMID 16415161
§
Sanchez, J; B�rsting, C; Hallenberg, C; Buchard, A;
Hernandez, A; Morling, N (2003), "Multiplex PCR and minisequencing of
SNPs—a model with 35 Y chromosome SNPs", Forensic Sci Int 137(1): 74–84, doi:10.1016/S0379-0738(03)00299-8, PMID 14550618
§
Scozzari, R; Cruciani, F; Pangrazio, A; Santolamazza, P; Vona, G;
Moral, P; Latini, V; Varesi, L et al. (2001), "Human Y-Chromosome Variation in the Western Mediterranean Area: Implications
for the Peopling of the Region", Human Immunology 62 (9): 871, doi:10.1016/S0198-8859(01)00286-5, PMID 11543889
§
Semino, O.; Passarino, G; Oefner, PJ; Lin, AA; Arbuzova, S; Beckman, LE; De
Benedictis, G; Francalacci, P et al. (2000), "The Genetic Legacy of Paleolithic Homo sapiens
sapiens in
Extant Europeans: A Y Chromosome Perspective", Science 290 (5494): 1155–59, doi:10.1126/science.290.5494.1155, PMID 11073453. Copy can be found athttp://www.historyofmacedonia.org/ConciseMacedonia/Y_Hromosomes.pdf.
§ Sengupta, S; Zhivotovsky, LA; King, R; Mehdi, SQ; Edmonds, CA; Chow, CE; Lin, AA; Mitra, M et al. (2005), "Polarity and Temporality of High-Resolution Y-Chromosome Distributions in India Identify Both Indigenous and Exogenous Expansions and Reveal Minor Genetic Influence of Central Asian Pastoralists", Am. J. Hum. Genet. 78 (2): 202–21, doi:10.1086/499411,PMC 1380230, PMID 16400607.
§
Sharma et al. (2007), "The Autochthonous Origin and a Tribal Link of Indian Brahmins:
Evaluation Through Molecular Genetic Markers", THE AMERICAN SOCIETY OF HUMAN GENETICS
57th Annual Meeting
§
Sharma, S; Rai, E; Sharma, P; Jena, M; Singh, S;
Darvishi, K; Bhat, AK; Bhanwer, AJ et al. (2009), "The Indian origin of paternal haplogroup R1a1(*)substantiates the
autochthonous origin of Brahmins and the caste system", J. Hum.Genet. 54 (1): 47–55, doi:10.1038/jhg.2008.2, PMID 19158816
§
Shilz (2006), Molekulargenetische Verwandtschaftsanalysen am prähistorischen
Skelettkollektiv der Lichtensteinhöhle, Dissertation, Göttingen
§
Soares, Pedro; Achilli, Alessandro; Semino, Ornella; Davies, William; MacAulay,
Vincent; Bandelt, Hans-JüRgen; Torroni, Antonio; Richards, Martin B. (2010), "The Archaeogenetics of Europe", Current Biology 20 (4): R174, doi:10.1016/j.cub.2009.11.054, PMID 20178764
§
Tambets, K; Rootsi, S; Kivisild, T; Help, H; Serk, P; Loogv�li, EL; Tolk, HV; Reidla, M et al. (2004), "The Western and Eastern Roots of the Saami—the Story of Genetic
'Outliers' Told by Mitochondrial DNA and Y Chromosomes", American Journal of Human Genetics 74 (4): 661–682, doi:10.1086/383203, PMC 1181943, PMID 15024688
§
Underhill, Peter A; Myres, Natalie M; Rootsi, Siiri; Metspalu, Mait;
Zhivotovsky, Lev A; King, Roy J; Lin, Alice A; Chow, Cheryl-Emiliane T et al.
(2009), "Separating the post-Glacial coancestry of European and Asian Y
chromosomes within haplogroup R1a", European Journal of Human Genetics 18 (4): 479, doi:10.1038/ejhg.2009.194, PMC 2987245, PMID 19888303
§
Varzari, Alexander (2006), "Population History of the Dniester-Carpathians: Evidence from Alu
Insertion and Y-Chromosome Polymorphisms", Dissertation der Fakultät für Biologie der
Ludwig-Maximilians-Universität München
§
Völgyi, Antónia; Zal�n, Andrea; Szvetnik, Enikő; Pamjav,
Horolma (2008), "Hungarian population data for 11 Y-STR and 49 Y-SNP
markers", Forensic Science International: Genetics 3 (2): e27,doi:10.1016/j.fsigen.2008.04.006
§
Wang et al. (2003), "The origins and genetic structure of
three co-resident Chinese Muslim populations: the Salar, Bo'an and
Dongxiang", Human
Genetics
§
Weale, Michael; Yepiskoposyan, L; Jager, RF;
Hovhannisyan, N; Khudoyan, A; Burbage-Hall, O; Bradman, N; Thomas, MG (2001), "Armenian Y chromosome haplotypes reveal strong regional structure
within a single ethno-national group", Hum Genet 109 (6): 659–674, doi:10.1007/s00439-001-0627-9, PMID 11810279
§ Weale, S; Zhivotovsky, LA; King, R; Mehdi, SQ; Edmonds, CA; Chow, CE; Lin, AA; Mitra, M et al. (2002), "Y Chromosome Evidence for Anglo-Saxon Mass Migration", Mol. Biol. Evol. 19 (7): 1008–1021, PMID 12082121.
§
Wells, R. S.; Yuldasheva,
N; Ruzibakiev, R; Underhill, PA; Evseeva, I; Blue-Smith, J; Jin, L;
Su, B et al. (2001), "The Eurasian Heartland: A continental perspective on Y-chromosome
diversity",Proc.
Natl. Acad. Sci. U. S. A. 98 (18): 10244–9, doi:10.1073/pnas.171305098, PMC 56946, PMID 11526236. Also at http://www.pnas.org/cgi/reprint/98/18/10244.pdf
§
Wells,
Spencer (2002), The Journey of Man: A Genetic Odyssey, Princeton University Press, ISBN 069111532X.
§ Wilson, J. F.; Weiss, DA; Richards, M; Thomas, MG; Bradman, N; Goldstein, DB (2001), "Genetic evidence for different male and female roles during cultural transitions in the British Isles",Proc. Natl. Acad. Sci. USA 98 (9): 5078–5083, doi:10.1073/pnas.071036898, PMC 33166, PMID 11287634
§
Y Chromosome Consortium "YCC" (2002), "A Nomenclature System for the Tree of Human Y-Chromosomal Binary
Haplogroups", Genome Research 12 (2): 339–348,doi:10.1101/gr.217602, PMC 155271, PMID 11827954
§
Zerjal, T; Beckman, L; Beckman, G; Mikelsaar, AV; Krumina, A; Kucinskas, V;
Hurles, ME; Tyler-Smith, C (2001), "Geographical, linguistic, and cultural influences on genetic
diversity: Y-chromosomal distribution in Northern European populations", Mol Biol Evol 18 (6): 1077–1087, PMID 11371596
§
Zerjal, T; Wells, RS; Yuldasheva, N; Ruzibakiev, R; Tyler-Smith, C (2002), "A Genetic Landscape Reshaped by Recent Events: Y-Chromosomal
Insights into Central Asia", Am J Hum Genet.71 (3): 466–482, doi:10.1086/342096, PMC 419996, PMID 12145751
§
Zhou, Ruixia; An, Lizhe; Wang, Xunling; Shao, Wei; Lin,
Gonghua; Yu, Weiping; Yi, Lin; Xu, Shijian et al. (2007), "Testing the hypothesis of an ancient Roman soldier origin of the
Liqian people in northwest China: a Y-chromosome perspective", Journal of Human Genetics, 52 (7): 584, doi:10.1007/s10038-007-0155-0, PMID 17579807
§
Zhao, Zhongming; Khan, Faisal; Borkar, Minal; Herrera, Rene; Agrawal,
Suraksha (2009), "Presence of three different paternal lineages among North Indians:
A study of 560 Y chromosomes", Annals of Human Biology 36 (1): 1–14, doi:10.1080/03014460802558522, PMC 2755252, PMID 19058044
§
Zhivotovsky, L; Underhill, PA; Cinnio�lu, C; Kayser, M; Morar, B; Kivisild, T;
Scozzari, R; Cruciani, F et al. (2004), "The effective mutation rate at Y chromosome short tandem repeats,
with application to human population-divergence time", Am J Hum Genet 74 (1): 50–61, doi:10.1086/380911, PMC 1181912, PMID 14691732
Projects
THURSDAY, NOVEMBER 5, 2009
R1a1a7: a signal of
Slavic expansions from Poland
Nature has just published a fascinating article on the discovery of a new type of R1a1a, defined by the M458 mutation.
The data included in the report firmly puts present day Poland as the most
likely place of origin for this haplogroup, known as R1a1a7. Here's a nice
map...

Peter A Underhill et al., Separating
the post-Glacial coancestry of European and Asian Y chromosomes within
haplogroup R1a, European Journal of
Human Genetics advance online publication 4 November 2009; doi:
10.1038/ejhg.2009.194
However, as per above, the authors claim that R1a1a7 has an age of about
10.7KY. This, they say, makes it a signal of migrations carrying agriculture
from Central-East Europe to present day Ukraine and European Russia.
Unfortunately, that doesn't make any sense, because M458 is very rare in
Scandinavia, which was largely populated from North/Central Europe after the
Ice Age. Recent work on the population movements around the Baltic has suggested that both
R1a1 and I1a moved up from Germany and Poland into Sweden. So why was so little
of M458 discovered up there in this study?

R1a1a7; A Signal Of Slavic
Expansions From Poland
Filed under: Genetics, Indo-Europeans, Poland — admin @ 1:57 pm
Originally posted by Polako alias David Kowalski at Polish Genetics
and Anthropology Blog.
Nature has just published a very interesting article on the discovery of a new type of R1a1a, defined by
the M458 marker. The data included in the report firmly puts present day Poland
in the driving seat as the place of origin for this lineage, known as R1a1a7.
Here’s a nice map…
v:shapes="_x0000_i1044">
Peter A Underhill et al., Separating the
post-Glacial coancestry of European and Asian Y chromosomes within haplogroup
R1a, European Journal of Human Genetics
advance online publication 4 November 2009; doi: 10.1038/ejhg.2009.194
However, as per
above, the authors claim that R1a1a7 has an age of about 10.7KY. This, they
say, makes it a signal of migrations carrying agriculture from Central-East
Europe to present day Ukraine and European Russia. Unfortunately, that doesn’t
make any sense, because M458 is very rare in Scandinavia, which was largely
populated from North/Central Europe after the Ice Age. Recent work on the population movements around the Baltic have
shown that both R1a1 and I1a moved up from Germany and Poland into Sweden. So
why was only one case of M458 discovered up there in this study?
T. Lappalainen et al., Migration Waves to the
Baltic Sea Region, Annals of Human Genetics, Volume 72 Issue 3, Pages 337 – 348, doi:
10.1111/j.1469-1809.2007.00429.x
My take on what’s
happened here is that the authors grossly overestimated the age of M458, by
about three times. The real figure is probably somewhere between 3 and 4KY. So
it’s pretty obvious what we’re dealing with here are the various migrations of
Slavs around Central and Eastern Europe, probably starting in the upper Vistula
basin. These population movements took place well AFTER previous waves of R1a1
moved north and west from or via present day Poland.
Based on their
inflated age and expansion time estimates for M458, the authors also conclude
that it’s unlikely there were any major post-Ice Age movements from Eastern
Europe to Asia. This implies they trust their own methodology more than the
recent results of ancient DNA studies, which clearly showed that European
groups carrying R1a1 migrated in a big way to South Siberia during the
Chalcolithic and Bronze Age (see here). Indeed, the west to east movements of these
Scytho-Siberians were also tracked by a recent cranial study of their remains (here). So well done on finding the new R1a1 marker, but
geez, there’s something not quite right there with those haplogroup age
estimates again. When will that change I wonder?
"Slavic" R1a1a7
found in a German medieval grave
The old R1a1a7, now known as R1a1a1g, struck me as a
really god candidate for a marker of proto-Slavic expansions when it was first
announced (see here). Nothing's really changed since then, and it has now acted as
something of a tie-breaker in an effort to identify the ethnic affiliation of a
medieval German community. Physical anthropology couldn't quite figure out
whether the skeletons dug up from a 12th to 13th century burial ground in
Mecklenburg-Vorpommern were German, Danish or Slavic. However, one of the
samples came back as R1a1a7, which certainly upped the chances of that grave
yard being at least partly of Slavic origin.
This
study investigates 200 skeletons from an early Christian graveyard of the 12th
to early 13th century in Usedom (Mecklenburg-Vorpommern, Germany). The city of
Usedom was a notable maritime place of trade in a time of major political and
social transformations. The Christianisation of the Slavic elite in 1128, the
following raids of the Danes and the influx of German settlers starting in the
13th century were formative events.
The reconstruction of the living conditions of the Usedom population was
achieved by means of well established anthropological and palaeodemographical
methods. Age and sex distribution comply with other ordinary populations of
that time frame: high proportion of children (32 %), comparatively few
adolescents but many adults (59 %) as well as a slight surplus in men.
Remarkably, a deficit in women in the mature age class is attended by an
increased mortality of girls of the age class infans I. However, this may be
due to a methodical error.
In order to clarify a possible Slavic, Danish or German background of the
inhabitants of Usedom, eight skull measures, four skull indices and five
measures of the long bones of the extremities were investigated typologically
as well as statistically on the basis of their arithmetic means and compared to
the measures of two series of Slavic or multiethnic/place of trade background
(Sanzkow and Haithabu, respectively). The comparison of arithmetic means did
yield statistically significant differences between the three populations. The
men and women of Usedom seem to be more closely related to the Sanzkow
population. However, they appear to take a position between the two other
populations. Unfortunately, a
comparison with Slavic and Germanic populations of the Neolithic till Early
Middle Ages did not provide distinct results. The archaeologically based
assumption of a mainly Slavic population cannot be rejected with
anthropological means.
The analysis of mitochondrial and Y-chromosomal DNA, however, generated auspicious
results despite adverse storage conditions. Results could be obtained from all
four samples. Two individuals were of mtDNA haplogroup H and two of haplogroup
K. Y-chromosome analysis
yielded haplogroups E1b1b and R1a1a7, respectively, in two males. Future molecular research will see
improved methods for the even more detailed reconstruction of human migration.
Janine Freder, Die mittelalterlichen
Skelette von Usedom - Anthropologische Bearbeitung unter besonderer
Berücksichtigung des ethnischen Hintergrundes, Doctoral thesis, 2010, Department of Biology, Chemistry and Pharmacy
Davidski
Labels: Anthropology;
osteometry; palaeodemography; Slavs; Danes; DNA; mitochondrial; Y chromosome
Forum Słowiańskie
R1a1a7 - slowianska ekspansja z terytorium Polski
Autor: al-kochol-8 16.08.10, 03:33
polishgenes.blogspot.com/2009/11/r1a1a7-signal-of-slavic-expansions-from.html
W zeszlym roku dokonano "rozbicia" struktury R1a, wyodrebniajac w
niej mutacje M458 definiujaca nowa haplogrupe R1a1a7, ktora jak sie
okazuje w najwiekszym stezeniu wystepuje w Polsce (36% w poludniowej
i 33% w centralnej). Mozna wiec chyba uwazac R1a1a7 za polski gen?
R1a1a7 zawedrowal az na Balkany (i Krete) i wystepuje dzis tam w
nastepujacych stezeniach: 2.2% na Krecie, 4.2% w Grecji, 8.8%
w "greckiej" czesci Macedonii. O dziwo w "jugoslowianskiej"
Macedonii jest go mniej, bo tylko 3.8%, co zapewne wynika z bledu
statystycznego.
Mutacja M458 jest bardzo rzadka w Skandynawii, pomimo ze R1a jest
tam popularnym haplotypem.
|
Память о собственной истории всегда хранилась нашими предками. Ещё в середине XIX в. были живы народные сказители, сохранявшие в устной передаче былины о делах Киевской Руси. Это является для нас мудрым наказом изучать наше прошлое. До недавнего времени историю целого народа выясняли через древние рукописи, археологические культуры, языкознание и антропологию. Источник: Научно-популярный ресурс "Молекулярная генеалогия"
Гаплогруппа R1a1a7 и формирование русского народа
ДНК-генеалогия как память о прошлом
Карта
распространения
тшинецкой
культуры ДНК-генеалогия
говорит нам,
что около 4
тыс. лет
назад где-то
на
территории
современной
Польши
произошло
важное, но
никем тогда
незамеченное
событие: в
семье
мужчины – носителя
гаплогруппы
R1a1a* родился
мальчик с новой
мутацией –
гаплогруппой
R1a1a7. Этому
мальчику
было
суждено
встать у
истоков
большей части
русского
народа.
Карта
частот
гаплогруппы
R1a1a
|
|
Разместил: Григорьев | Дата:
02.08.2010 |
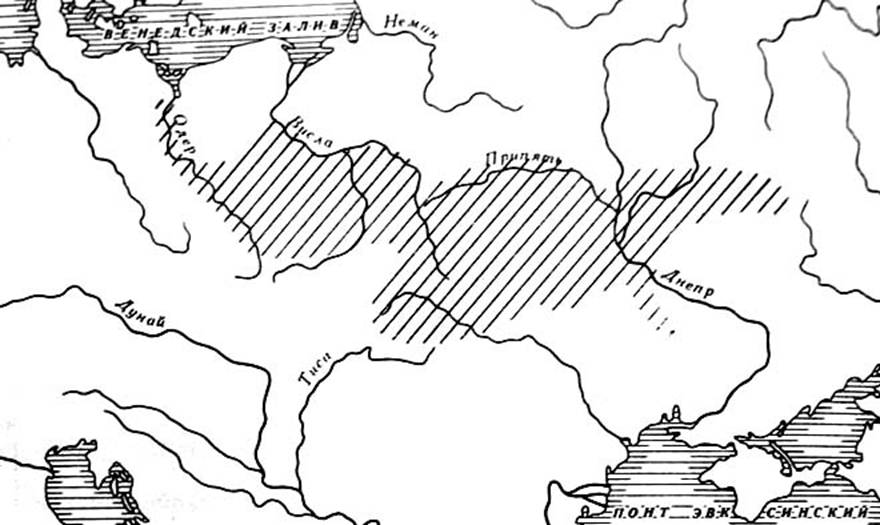
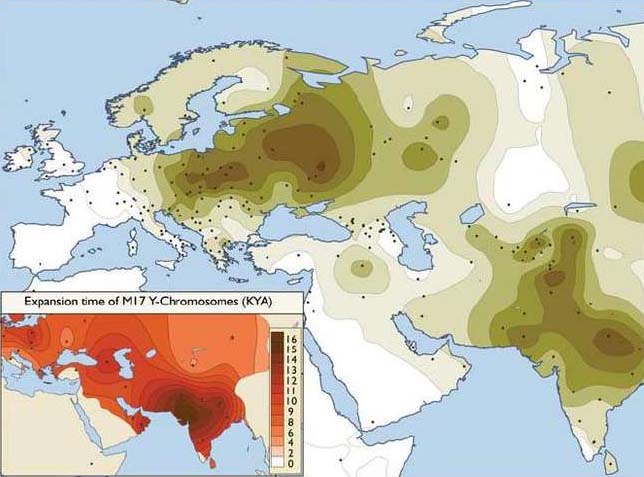
[ Напечатать статью | Отправить другу ]
Рейтинг
статьи
|
Средняя
оценка: |
|
Всего
голосов: |
10 |
|
|
|
|
|
|
Смотрите также связанные темы
|
|
2011-06-06
21:43:38 - ГЕНЕТИЧЕСКАЯ
ГЕНЕАЛОГИЯ:
ИСТОРИЯ И
МЕТОДОЛОГИЯ |
|
|
2011-04-28
22:00:08 - Анонс
проекта Magnus Ducatus Lituaniae |
|
|
2011-03-23
00:43:33 - База
данных
полных
сиквенсов
МтДНК - новый веб-сайт
в рамках
Гентис |
|
|
2011-03-06
10:52:20 - Российский
Журнал
Генетической
Генеалогии. Vol
1, No 1 (2009) |
|
|
2010-12-20
21:00:00 - Новогодний
подарок от
компании
ГЕНТИС |
|
|
|
|
2010-11-10
23:13:14 - Треть
однофамильцев
оказались
родственниками |
|
|
2010-09-29
21:41:46 - Генетики
Австралии
изучат
останки
семьи Аракчеевых |
|
|
2010-06-05
21:55:40 - Генетики
определили
происхождение
таинственных
тибетцев |
|
|
2010-06-05
21:00:00 - Генетики
доказали
единство
еврейской
диаспоры |
|
|
2009-05-12
22:17:04 - Генеалогический
мега-проект
Михаила Темоша
или инновационные
методы в
генеалогии |
|
|
2009-05-02
18:00:00 - Whit Athey,
создатель
Y-гаплогруппного
предиктора |
|
|
2009-04-21
11:32:26 - Блог
Никиты
Максимова,
или вЖЖивую
о науке |
|
|
2008-12-29
21:00:00 - Кровная
весть
(статья с
фотографиями) |
|
|
2008-11-22
00:14:44 - Выращивая
генеалогическое
Древо... Одна
ветвь для
каждого. |
|
|
2008-09-14
19:48:47 - ISOGG - опыт
успешной
организации
изучения и
развития
ДНК-генеалогии |
|
|
2008-08-30 23:01:39 - Family
Tree DNA: взгляд со стороны |
|
|
2008-02-20
01:00:00 - Family Tree DNA:
новый офис,
новые
горизонты |
|
|
2008-01-06
02:00:00 - Польский
ДНК проект,
или зачем
нужны 67 маркеров |
|
|
2007-08-29
02:40:01 - Южно-Калифорнийская
Генеалогическая
выставка 2007 |
Traduction (russe > français)
Le
souvenir de notre propre histoire a toujours gardé nos ancêtres. Aussi loin que
milieu du XIX siècle. ont
été des conteurs populaires vivant, retenu à l'oral
transmission de l'épopée de la Russie kiévienne. Il
est sage pour nous
instructions pour l'étude de notre passé. Jusqu'à
récemment, l'histoire d'un peuple
découvert à travers les manuscrits anciens, culture archéologique, linguistique et
l'anthropologie.
Source: ressources populaires science »Généalogie moléculaire"
www.molgen.org
Auteur: Maxime Ilin
Haplogroupe R1a1a7 et la formation du peuple russe
La généalogie ADN comme un souvenir du passé
Le souvenir de notre propre histoire a toujours gardé nos ancêtres. Aussi loin
que
milieu du XIX siècle. ont été des conteurs populaires vivant, retenu à l'oral
transmission de l'épopée de la Russie kiévienne. Il est sage pour
nous
instructions pour l'étude de notre passé. Jusqu'à récemment,
l'histoire d'un peuple
découvert à travers les manuscrits anciens, culture archéologique,
linguistique et
l'anthropologie.
Récemment, à cet effet impliqués généalogie ADN -
sciences naturelles qui étudie la relation biologique des personnes. Méthodes pour
l'ADN
Généalogie peut avec une précision absolue la relation de
la ligne masculine et féminine d'une personne spécifique avec d'autres personnes.Et
à travers
relation des individus - et l'interrelation des peuples, certains de ces
la plupart des gens et composé. Ainsi,
nous pouvons apprendre à connaître leurs
origines,
ce que les gens que nous parents génétiquement proches, et ce - pas beaucoup.
Quels sont les principes de base
de
Traduction (russe > français)
Rhode R1a1
(M17)
Type progénitrices est né environ 20 mille ans, quelque part en Asie du Sud.
Environ 10 mille ans, les tribus appartenant à ce genre, ont atteint
Europe de l'Est et environ 6 mille ans, se sont installés dans le nord
Région de la mer Noire. Il ya une
hypothèse que le langage praindoevropeysky
née de cinq à six mille ans, il était dans la côte de la mer Noire du nord de
Tribes of the R1a1 genre, qui onovremenno avec ce cheval et apprivoisé
inventé les véhicules à roues. De la sorte langue ancienne des
langues R1a1
sonne sur tous les continents de la
planète. Proto indo-européenne a été le premier
R1a1 type réalisation, qui est
devenu la province de toute l'humanité.
R1a1 type de décantation plus contribué à la formation des différents
peuples d'Europe et d'Asie, ont joué tous les rôles dans l'histoire.
Merci à des qualités morales et intellectuelles remarquables du genre a été
fondateur de l'empire, qui se trouvait en Europe et en Asie. Le processus
d'élargissement
Empire russe a été réalisée par la force de la bonté et la justice. Il
distingués du clan impérial R1a1 des familles impériales de l'Europe possédait
la soif que pour le profit, dont l'état était en expansion grâce à
destruction des cultures locales, la discrimination et la destruction physique
des peuples conquis.
Alors que les langues finno-ougriennes, turques, et autres peuples sibériens
Empire russe ont maintenu leur identité et ont été engagés dans
La civilisation russe. Certains
d'entre eux a marché sur le niveau de tribus
relation à la civilisation
urbaine.
Rhode R1a1 toujours biaisée vers la création, et donc il est plus
célèbre pour ses poètes et des penseurs, savants et artistes. Ils ont été
les créateurs de nombreuses écoles scientifiques, fondamentalement modifié les
scientifiques
Perspectives du XX e siècle. Astronomie, chimie, physique,
métallurgie, la médecine,
génie électrique, la science de la biosphère, la géochimie, etc - tous ces sujets ont
été
sensiblement progressé en pensant R1a1 genre. Merci à l'intelligence
les efforts des hommes de l'humanité a fait un pas de géant - il
est sorti dans l'espace.
Histoire et modernité ne connais
pas une civilisation qui se développe dans
les mêmes conditions rudes et
serait donc techniquement plus
avancés. Tous les parle pour lui-même - à
travers l'histoire
type R1a1 ses réalisations ont
été pour le bénéfice de toute l'humanité.
Indo-aryenne branche de la
famille est le créateur de l'hindouisme R1a1 - l'un des
plus anciennes religions du
monde, qui est inhérente à l'esprit de tolérance envers
autre point de vue et de
croyance dans la renaissance de l'âme. L'hindouisme à travers un laïc
Société est venu à des idées
telles que le yoga et le végétarisme.
N'importe pochtet pour l'honneur
d'appartenir à l'R1a1 genre, dont la contribution
mesurée sur une échelle globale. Il se pourrait bien que le
lecteur
Ces lignes font également partie
de cette grande famille de créateurs. Assez
subir un test ADN simple de
prouver que cela est suffisant
tester votre ADN-Y par «Gentis."